

Institutional Characteristics
To understand our sustainability performance and consider how and what to improve, it’s helpful to contextualize and normalize our performance. Here is some information about UC Davis that frames sustainability efforts on campus.
What makes up UC Davis Population Built Environment Snapshot
What makes up UC Davis?
UC Davis is a public research university in the University of California system. For the purposes of sustainability performance reporting, UC Davis is characterized as having five campus sites, in addition to a clinic network and a variety of small facilities and leased spaces. Campus sites and facilities locations include:
UC Davis Campus
- UC Davis is adjacent to the city of Davis, California. The campus consists of academic, administrative, housing, community facilities and museums, agricultural research and teaching fields and Student Farm on a 5,300-acre campus. The Davis campus houses multiple professional schools (Education, Graduate School of Management, Law, Veterinary Medicine, and some School of Medicine facilities). This campus also operates considerable infrastructure including water supply facilities, a wastewater treatment plant, two central plants, an electrical substation, a large solar power plant, a biodigester and a bus fleet.
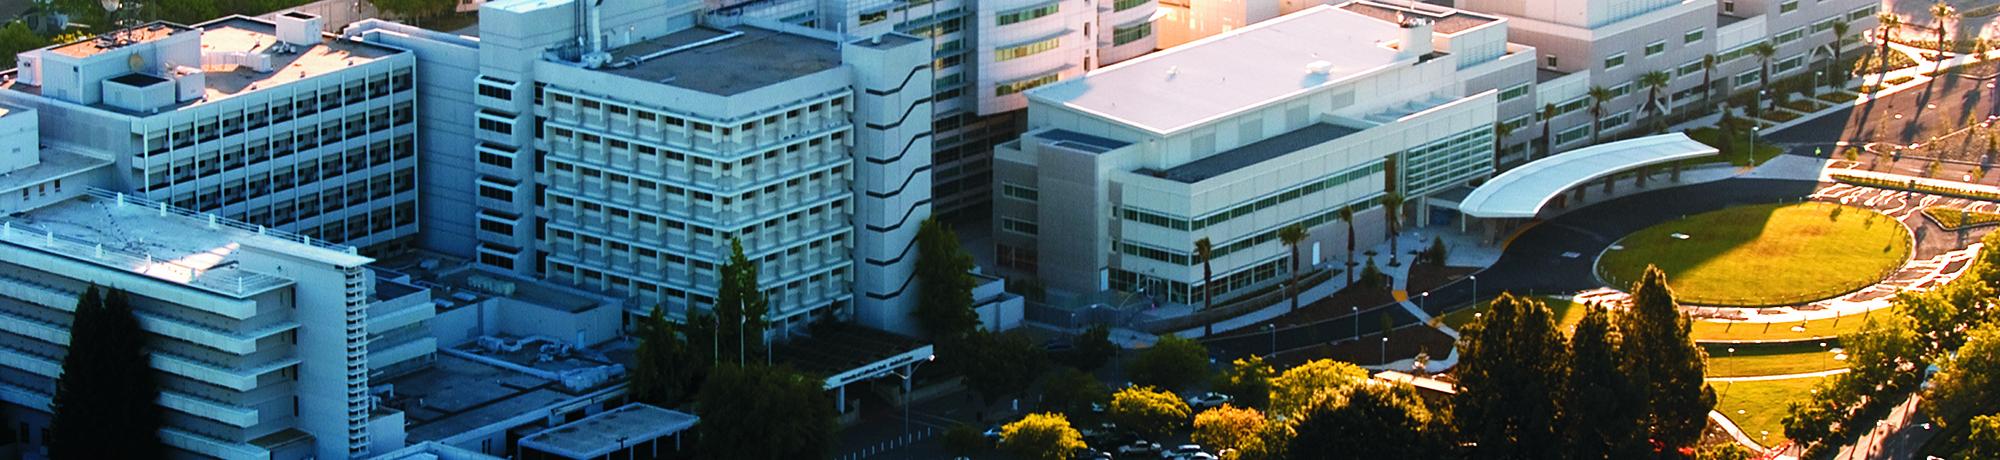
UC Davis Health
- UC Davis Health includes the UC Davis Health System Medical Center and the UC Davis Health System Clinic Network, which are both located in the greater Sacramento area in California. UC Davis Health System Medical Center consists of research, hospital, clinical and educational (School of Medicine and Betty Irene Moore School of Nursing) facilities on a 145-acre campus. UC Davis Health System Clinic Network consists of clinical healthcare facilities, mainly in leased space, located in cities throughout the northern Sacramento Valley of California. The Sacramento Medical Center campus operates a cogeneration central plant.
Outlying Facilities
- Bodega Marine Laboratory consists of laboratory facilities, a small boat fleet, and on-site researcher housing.
- Tahoe Environmental Research Center consists of two UC-owned buildings, a small boat fleet, and leased space in the Tahoe Basin primarily for the purpose of research on Lake Tahoe.
- Tulare South Valley Veterinary Medicine Teaching & Research Center, and California Animal Health & Food Safety Laboratory System in Tulare, California (Learn about the lab’s sustainable features.)
- Miscellaneous UC-owned small buildings or agricultural support facilities and equipment (irrigation pumps, for example) around the state, primarily in northern California; agricultural experiment stations and UC Natural Reserve System properties.
- Miscellaneous leased space around the state, primarily in northern California.
Population
We calculate specific population metrics to assess normative sustainability performance. For the UC Davis campus, we use a Weighted Campus User (WCU) metric from STARS. WCU is a figure used to adjust the campus population in order to account for the various impacts of distinct population groups on campus. For UC Davis Health, we use Adjusted Patient Day, which is a figure used to indicate the patient load in health operations and standardizes the number of days of patient care per year.
| Academic Year | Weighted Campus User |
|---|---|
| 2019-2020 | 36,680 |
| 2018-2019 | 36,426 |
| 2017-2018 | 35,475 |
| 2016-2017 | 34,457 |
| 2015-2016 | 33,340 |
| 2014-2015 | 33,716 |
| 2013-2014 | 32,256 |
| 2012-2013 | 31,186 |
| 2011-2012 | 30,382 |
| 2010-2011 | 29,928 |
| Baseline Year | 27,856 |
* Baseline Year is the average of weighted campus user from academic years 2005-2006, 2006-2007, and 2007-2008. This baseline is prescribed by the UC Sustainable Practices Policy, Sustainable Water Systems section.
UC Davis Health Adjusted Patient Day Metric
| Fiscal Year | Adjusted Patient Day |
|---|---|
| 2019-2020 | 328,007 |
| 2018-2019 | 326,021 |
| 2017-2018 | 314,379 |
| 2016-2017 | 308,360 |
| 2015-2016 | 291,296 |
| 2014-2015 | 280,150 |
| 2013-2014 | 271,308 |
| 2012-2013 | 259,029 |
| 2011-2012 | 244,535 |
| 2010-2011 | 238,540 |
Built Environment Snapshot
Like with population, we use building square footage and campus acreage to normalize some of our sustainability performance indicators. Both U.S. and metric units are given for land area and buildings.
The data shared in the table below is updated annually during UCOP reporting cycle in August; data below is current as of August 2020. The LEED™ certified buildings count is updated as of April 2021.
| Davis1 | Sacramento2 | |
|---|---|---|
| Campus size, in acres | 5,278 | 142 |
| Campus size, in hectares | 2,135.9 | 57.5 |
| Number of buildings and support structures (owned, leased and other) | 1,163 | 101 |
| Oldest building | 1907 | 1968 |
| Median age of all buildings (owned, leased, other) | 49 | 23 |
| Building square feet, expressed in GSF-1003 | 14,202,298 | 5,738,324 |
| Building square meters, calculated from GSF-100 | 1,319,437 | 533,108 |
| Number of “green” (LEED™ certified) buildings | 39 | 5 |
| Ratio of area on campus for water absorption including planted vegetation (lawns, gardens, green roofs, etc.) to total campus area4 | 65.99% | Not calculated |
| Ratio of parking area to total campus area5 | 2.24% | Not calculated |
Sources: UC Davis Capital Planning, UC Davis Campus Planning GIS, UC Davis Sustainability
- 1Davis includes the Davis campus, plus outlying facilities associated with research and teaching activities affiliated with the Davis campus
- 2Sacramento includes the Sacramento campus, plus clinical and research facilities associated with the Health System.
- 3GSF stands for Gross Square Feet, which essentially means that this is the sum of all horizontal areas on all floors of a building, including outside covered spaces; and the -100 indicates it includes the entire outside covered space.
- 4This figure is a combination of planted vegetation area, and water absorption area other than planted vegetation; these figures are reported to GreenMetric.
- 5This figure is reported to GreenMetric.