Tempestry Project

Tempestry Textile Art Display

To celebrate the 50th anniversary of Earth Day in April 2020, UC Davis Sustainability recruited volunteers to create a textile display that represents 50 years of climate change from 1970 to 2020.

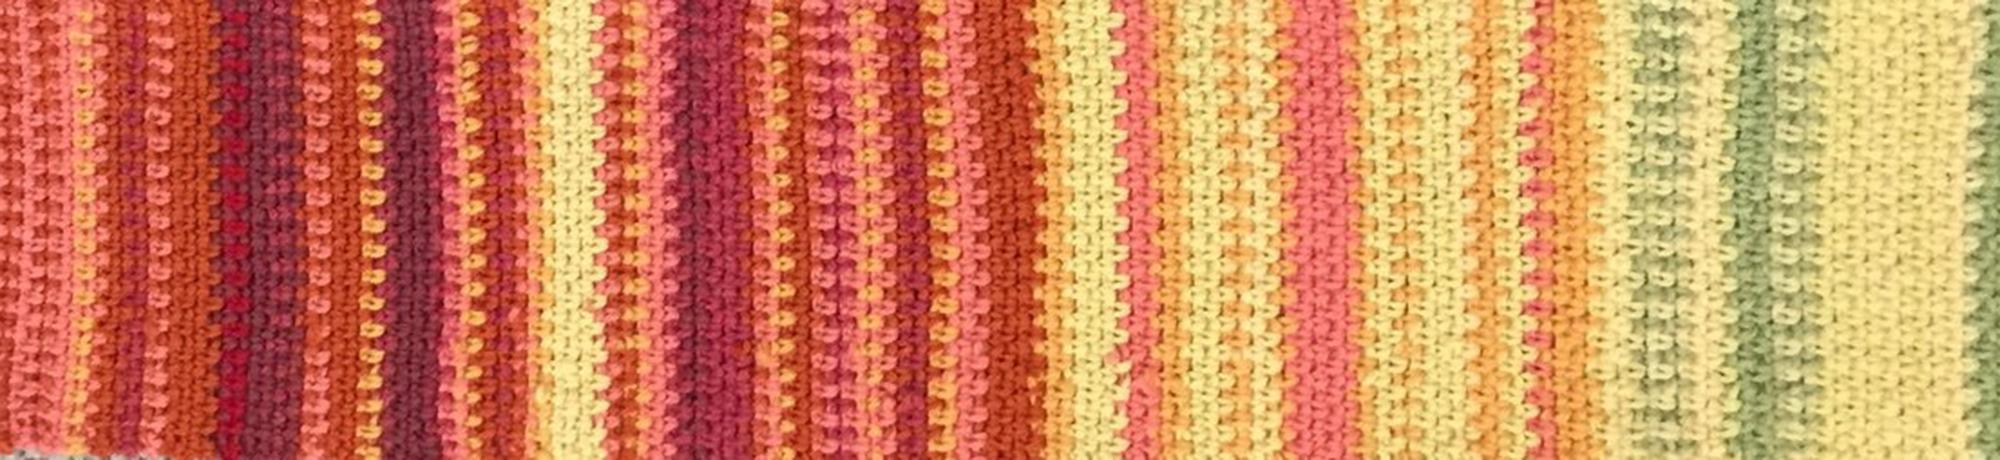
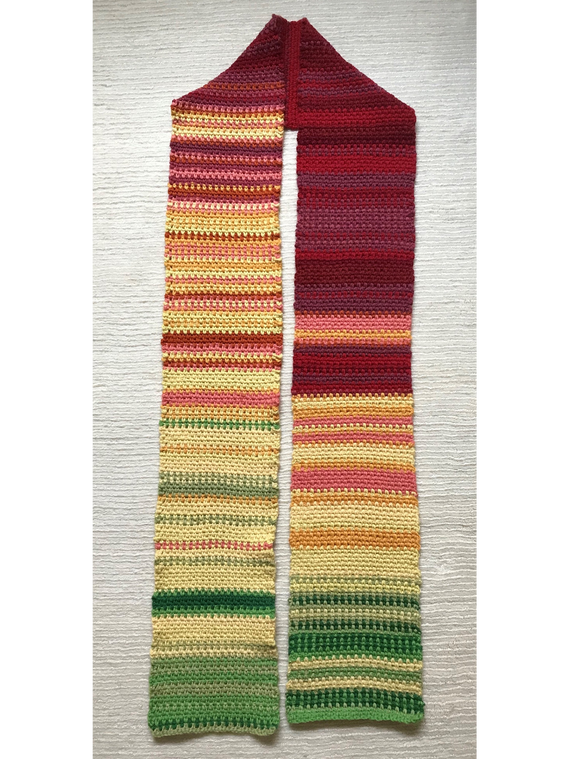
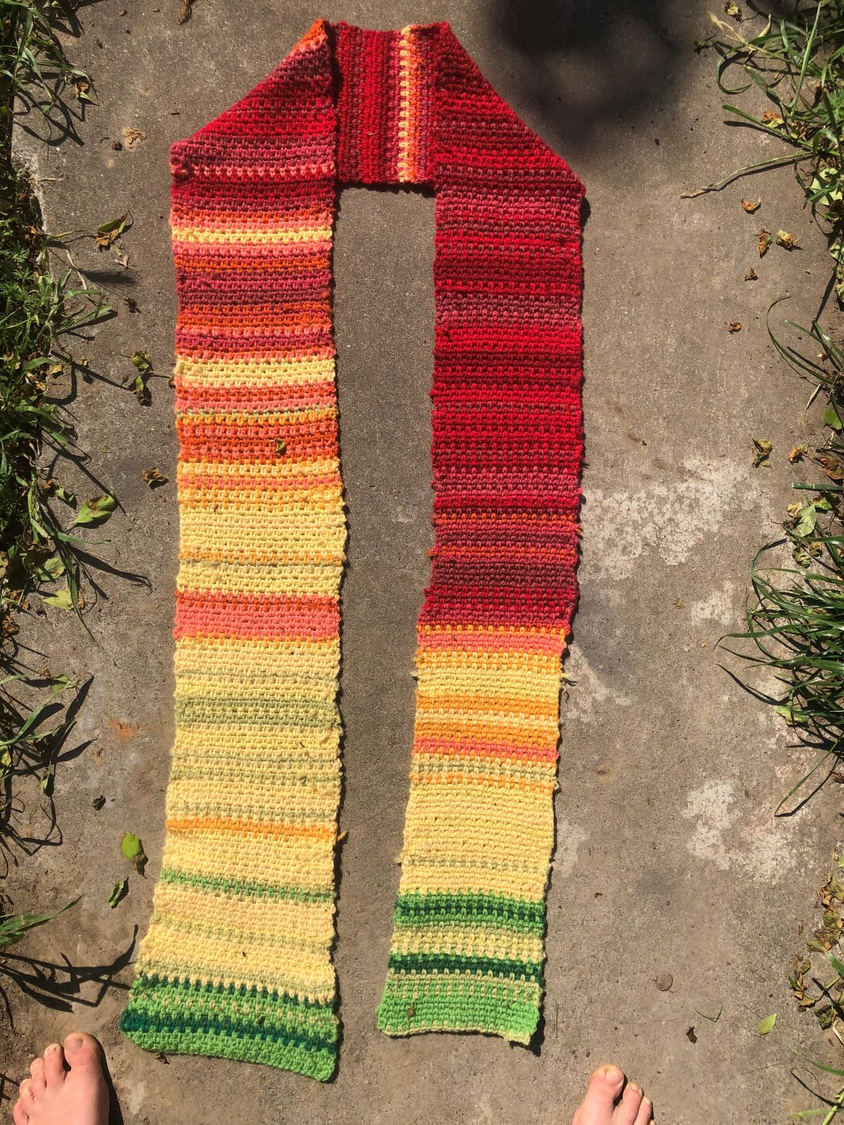
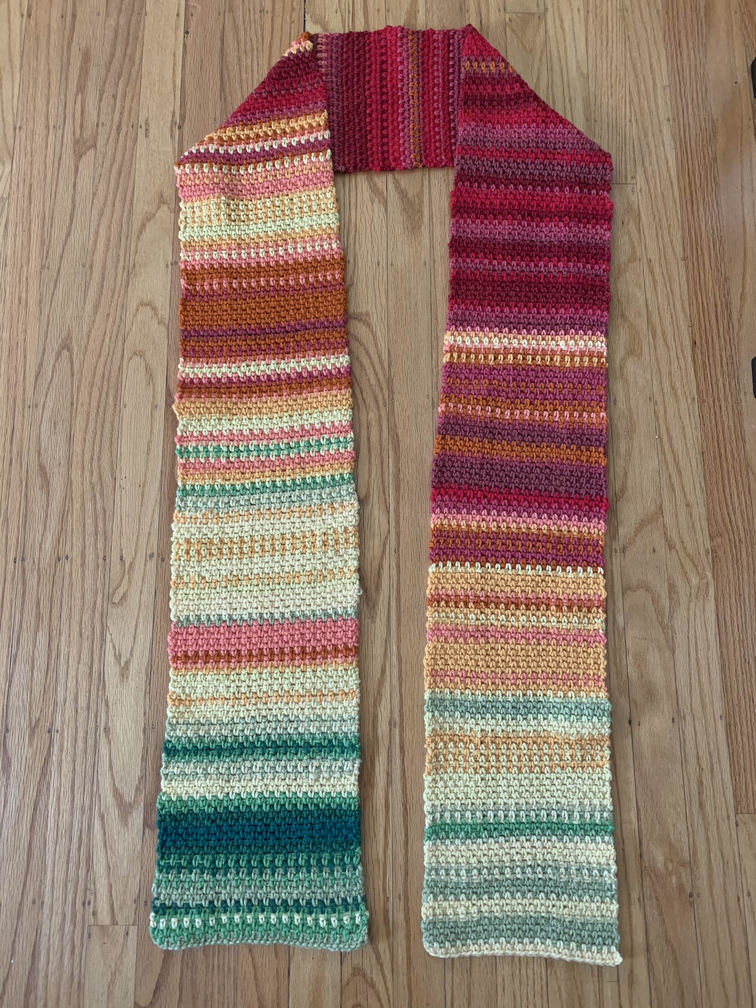
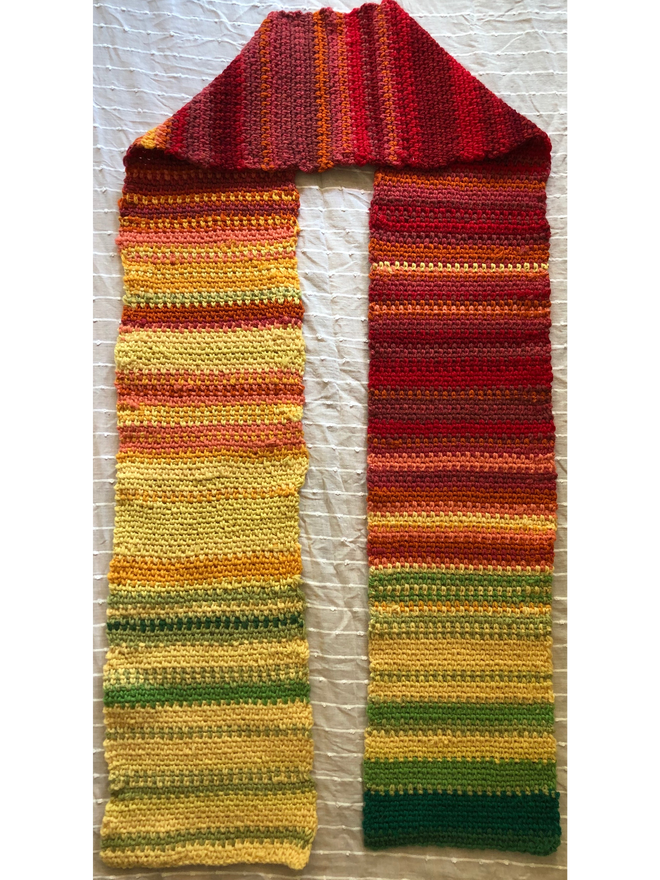
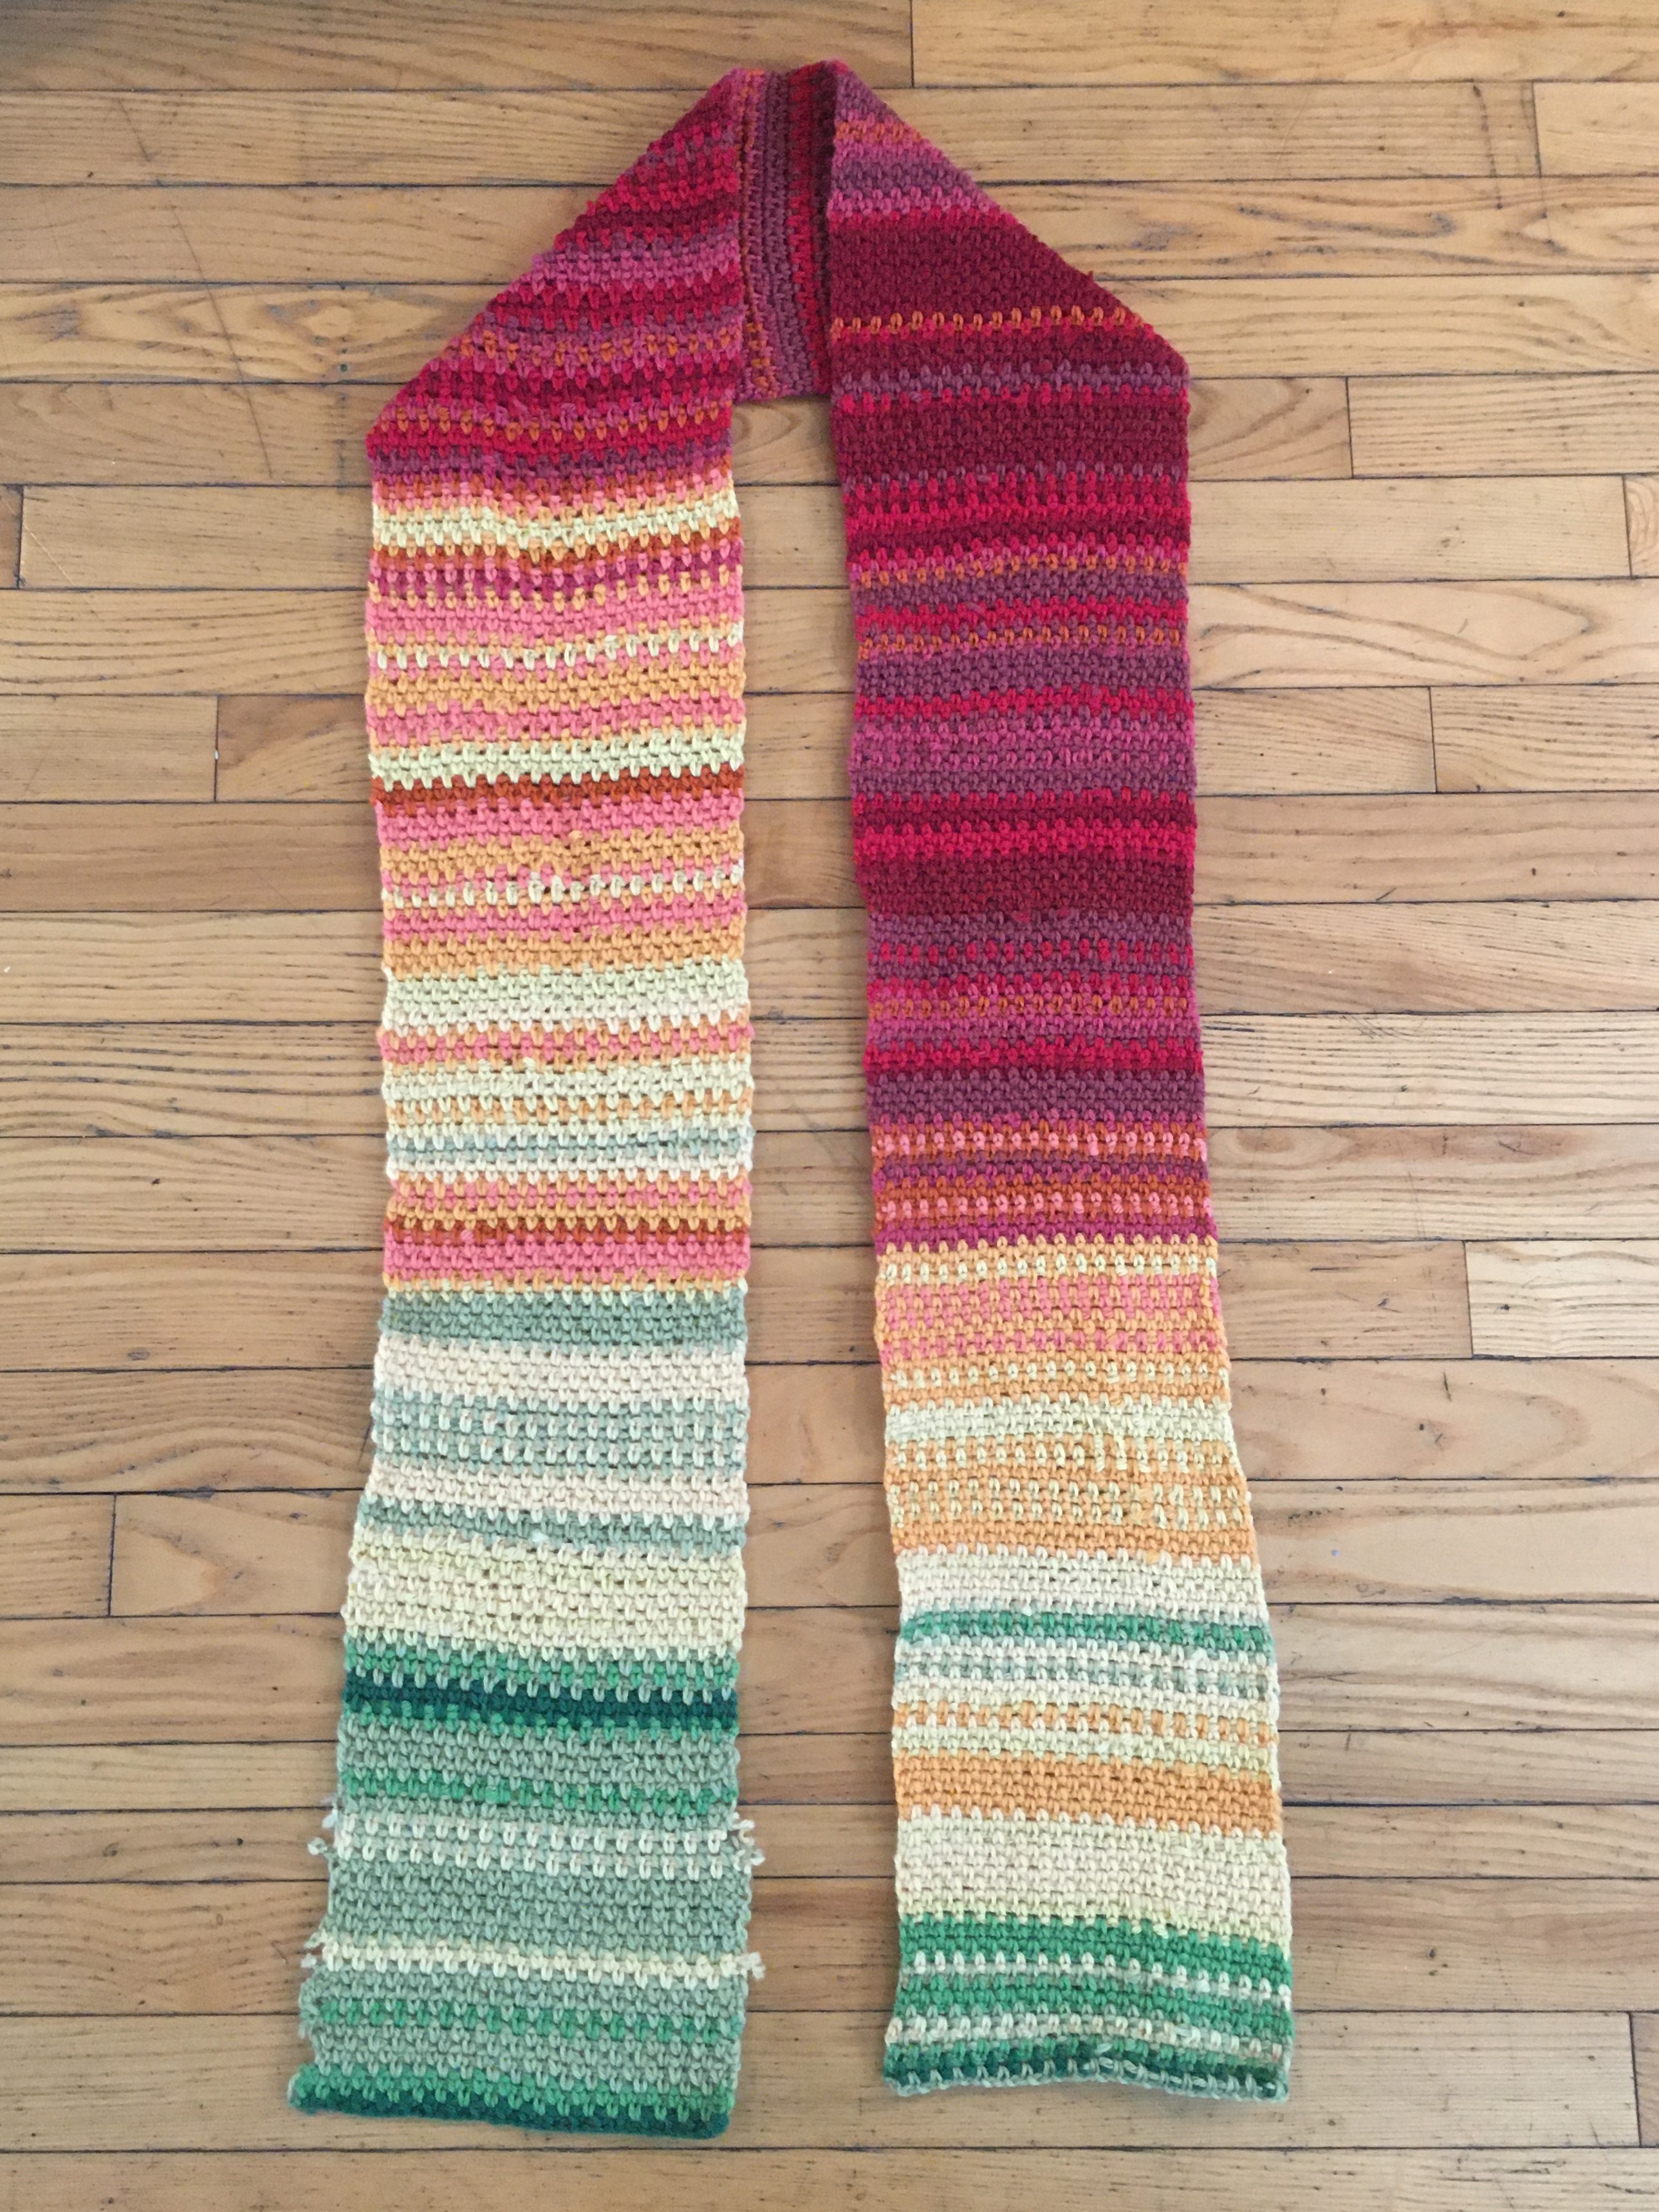
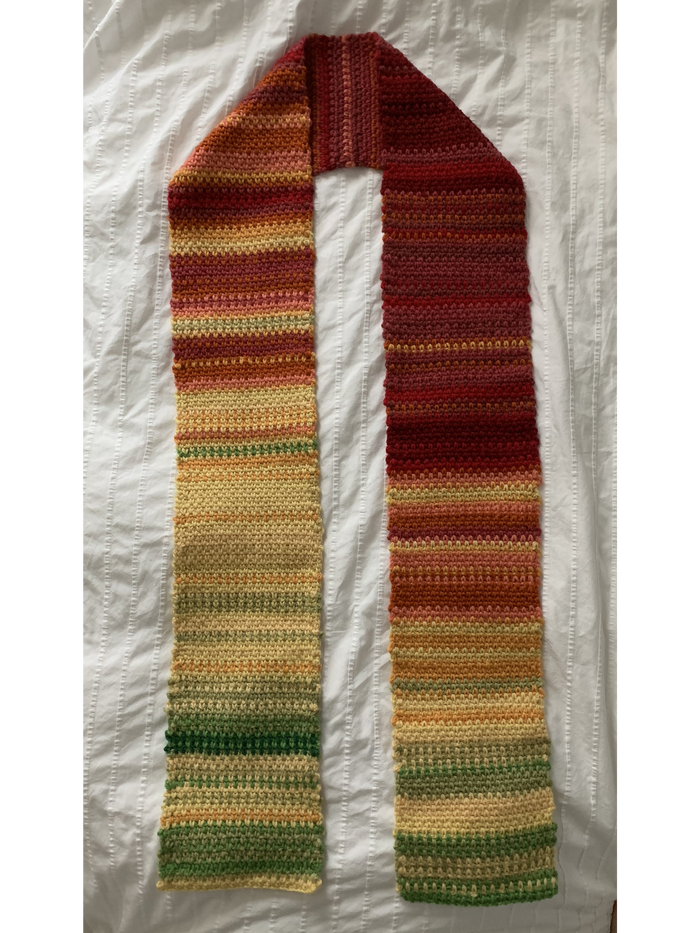
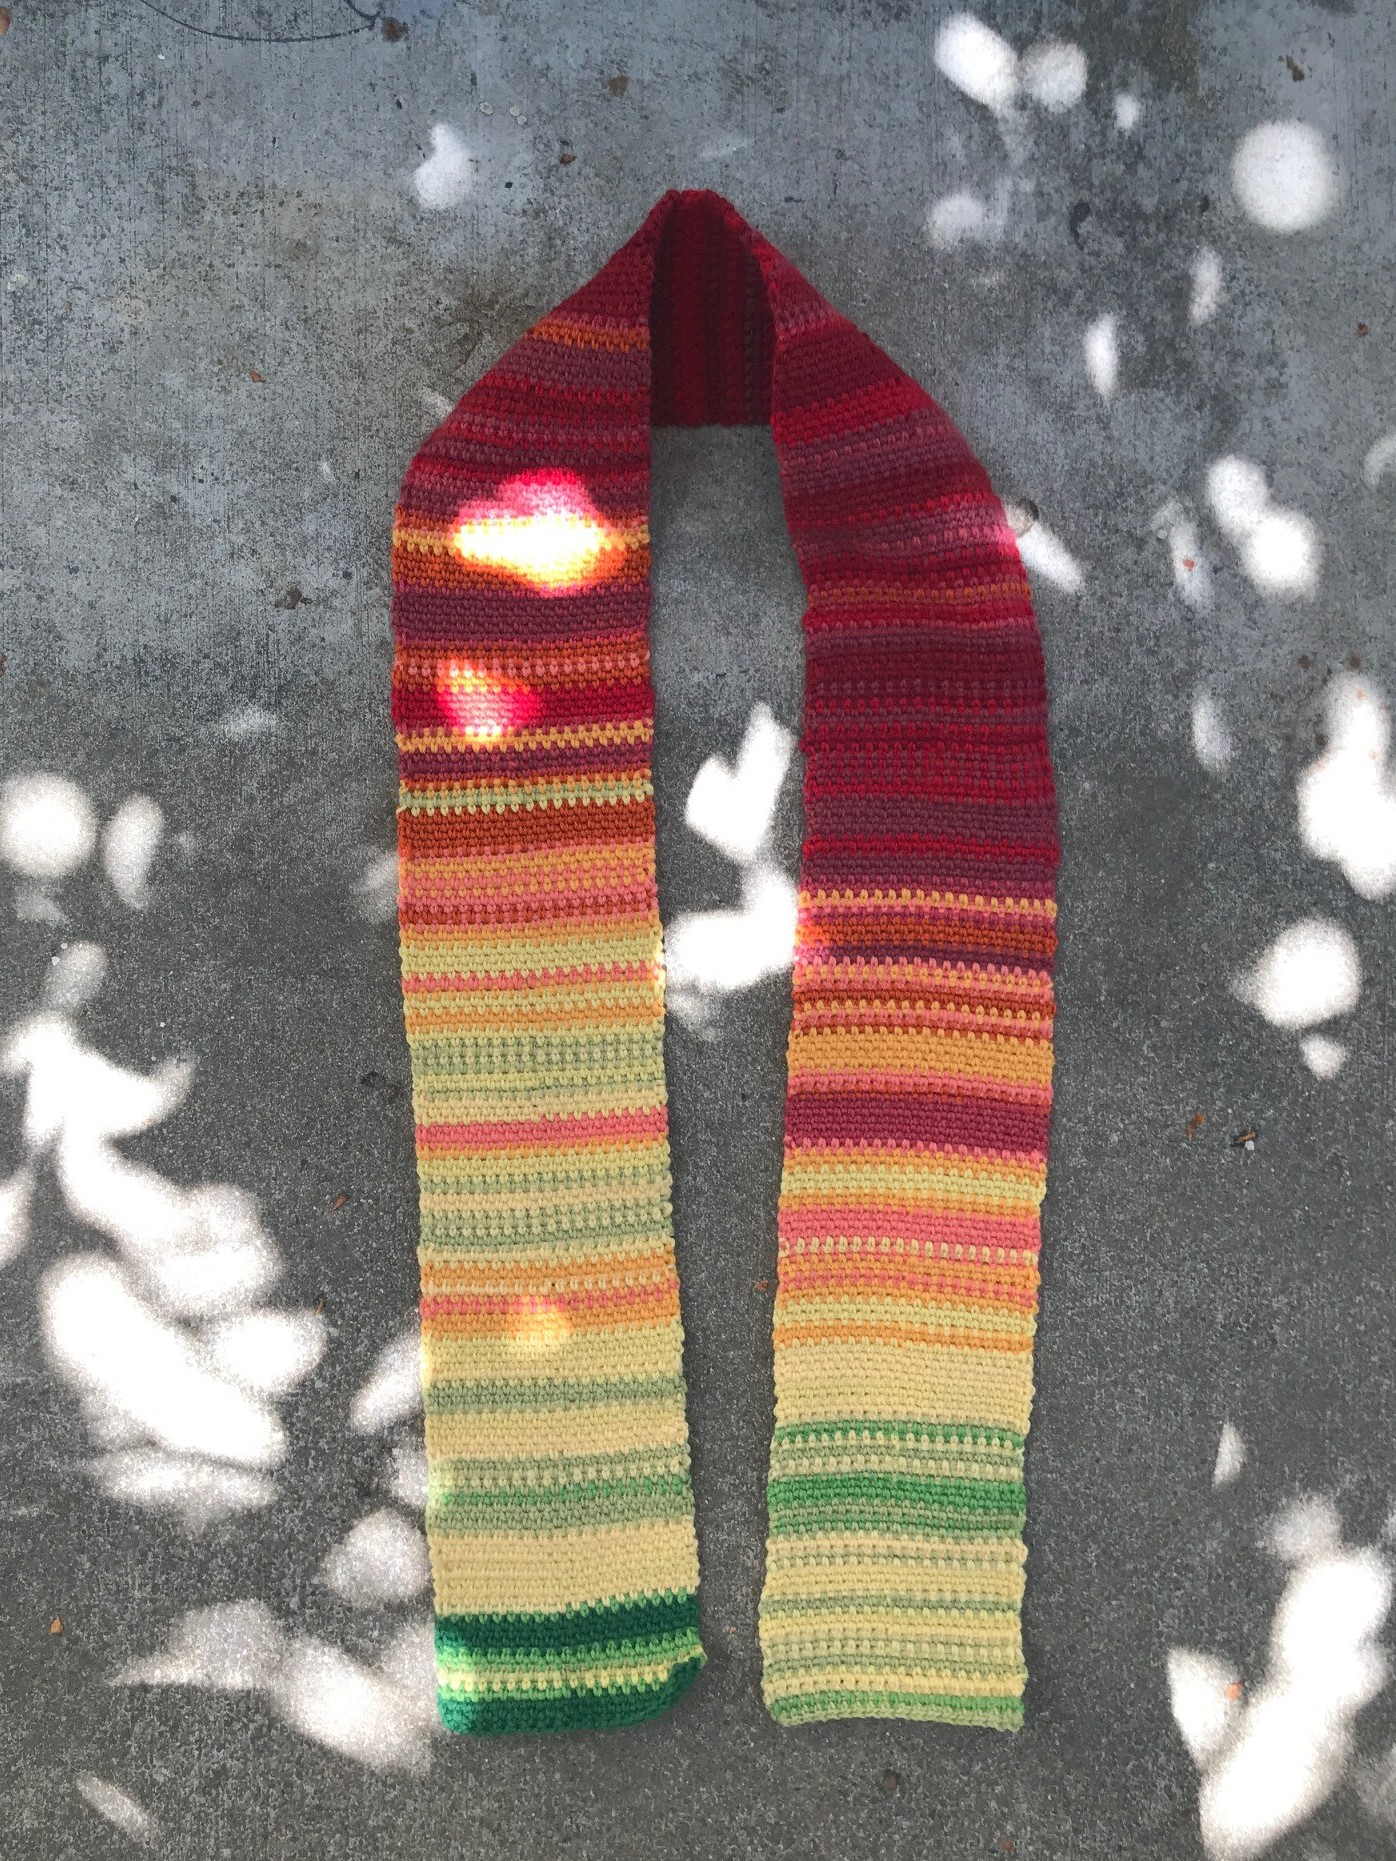
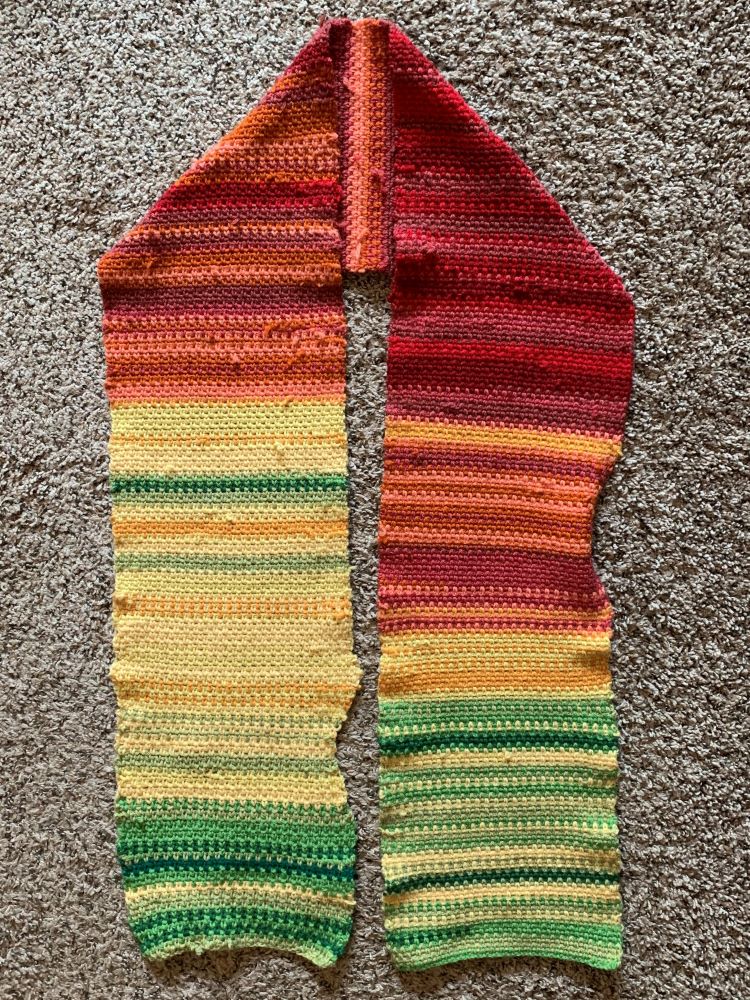
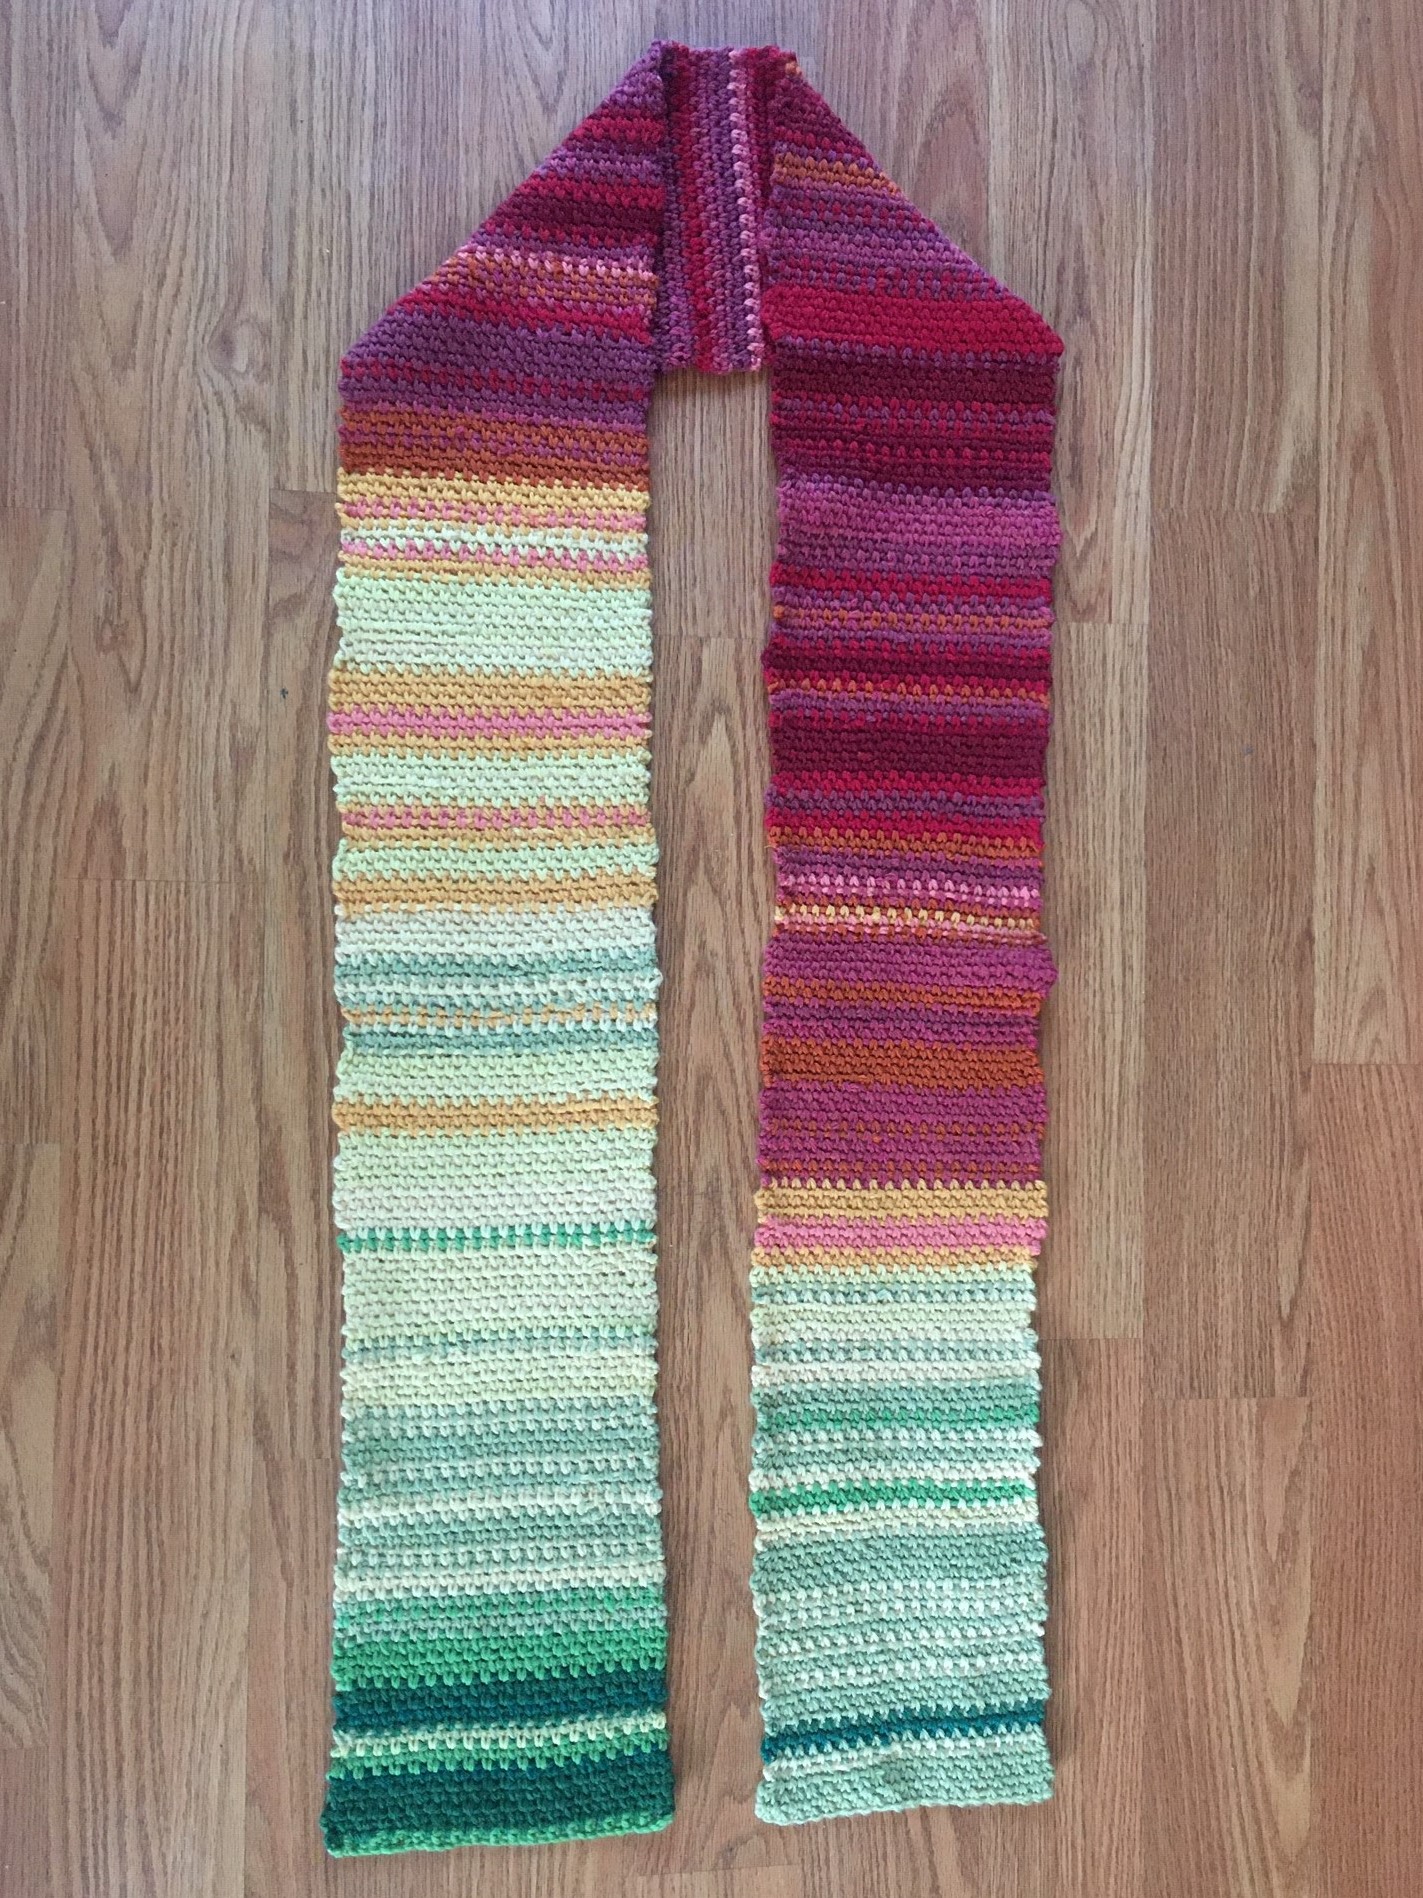
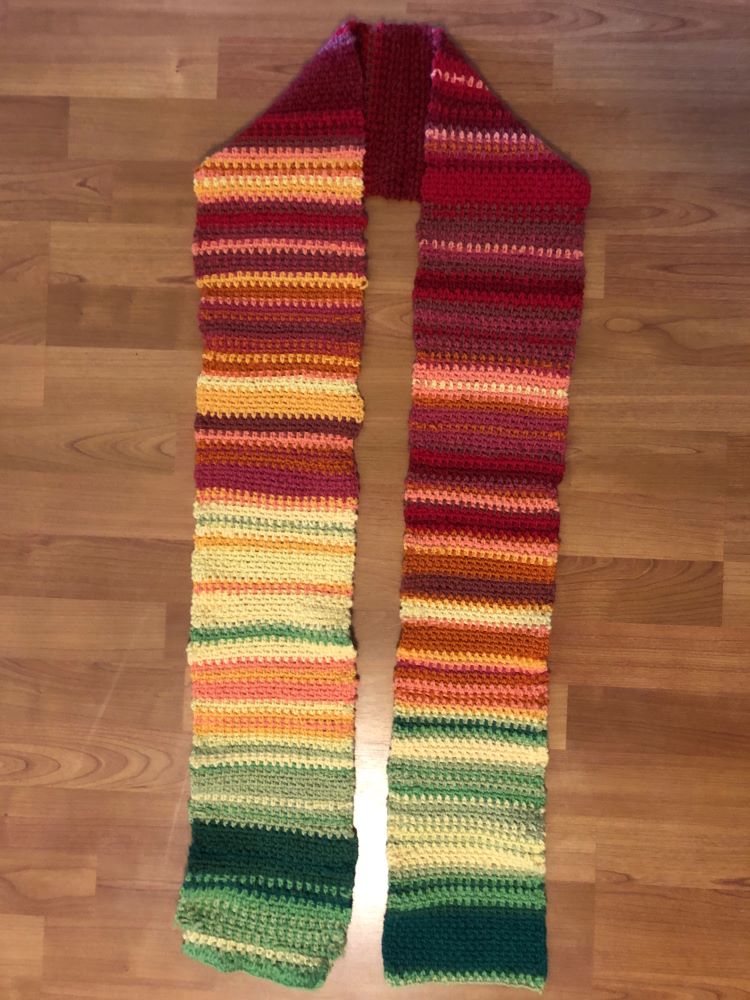
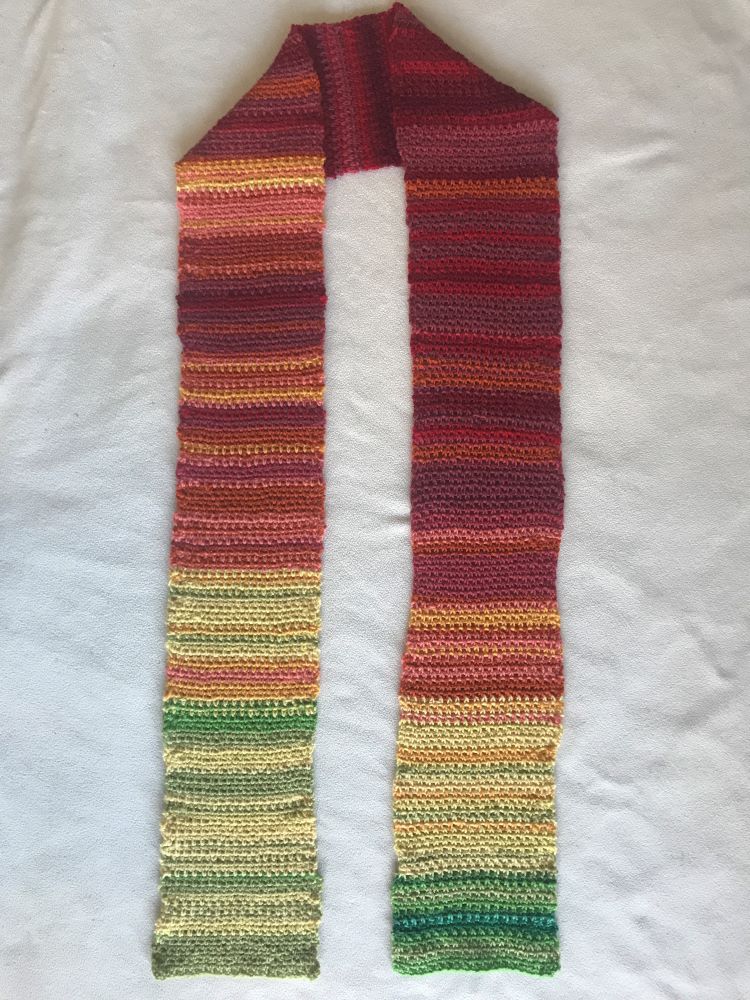
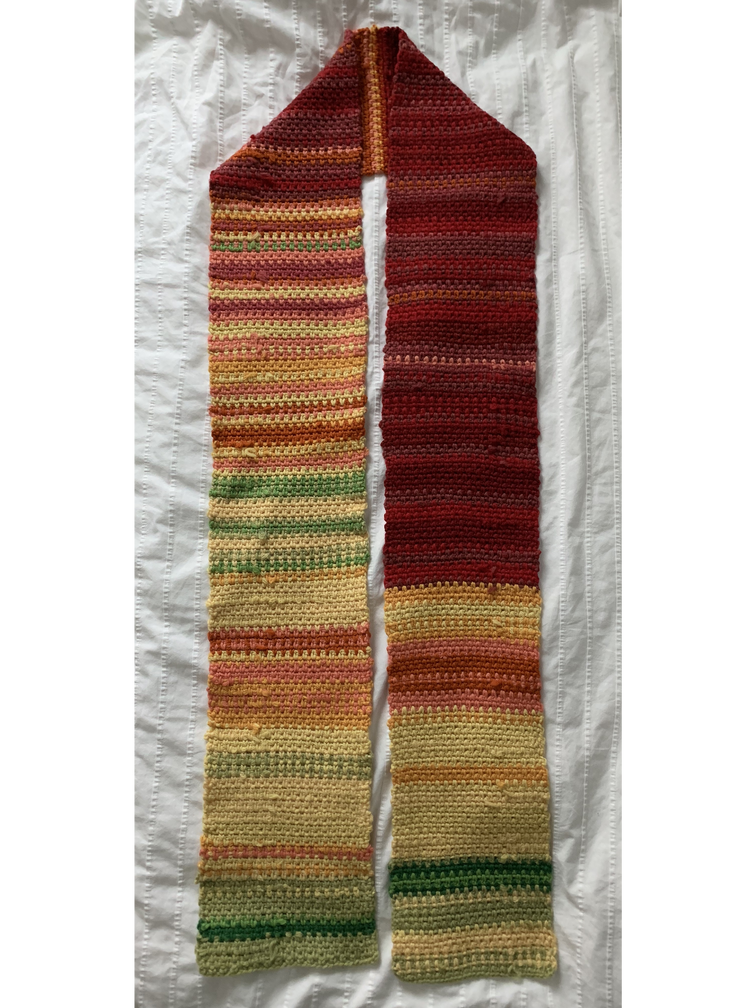
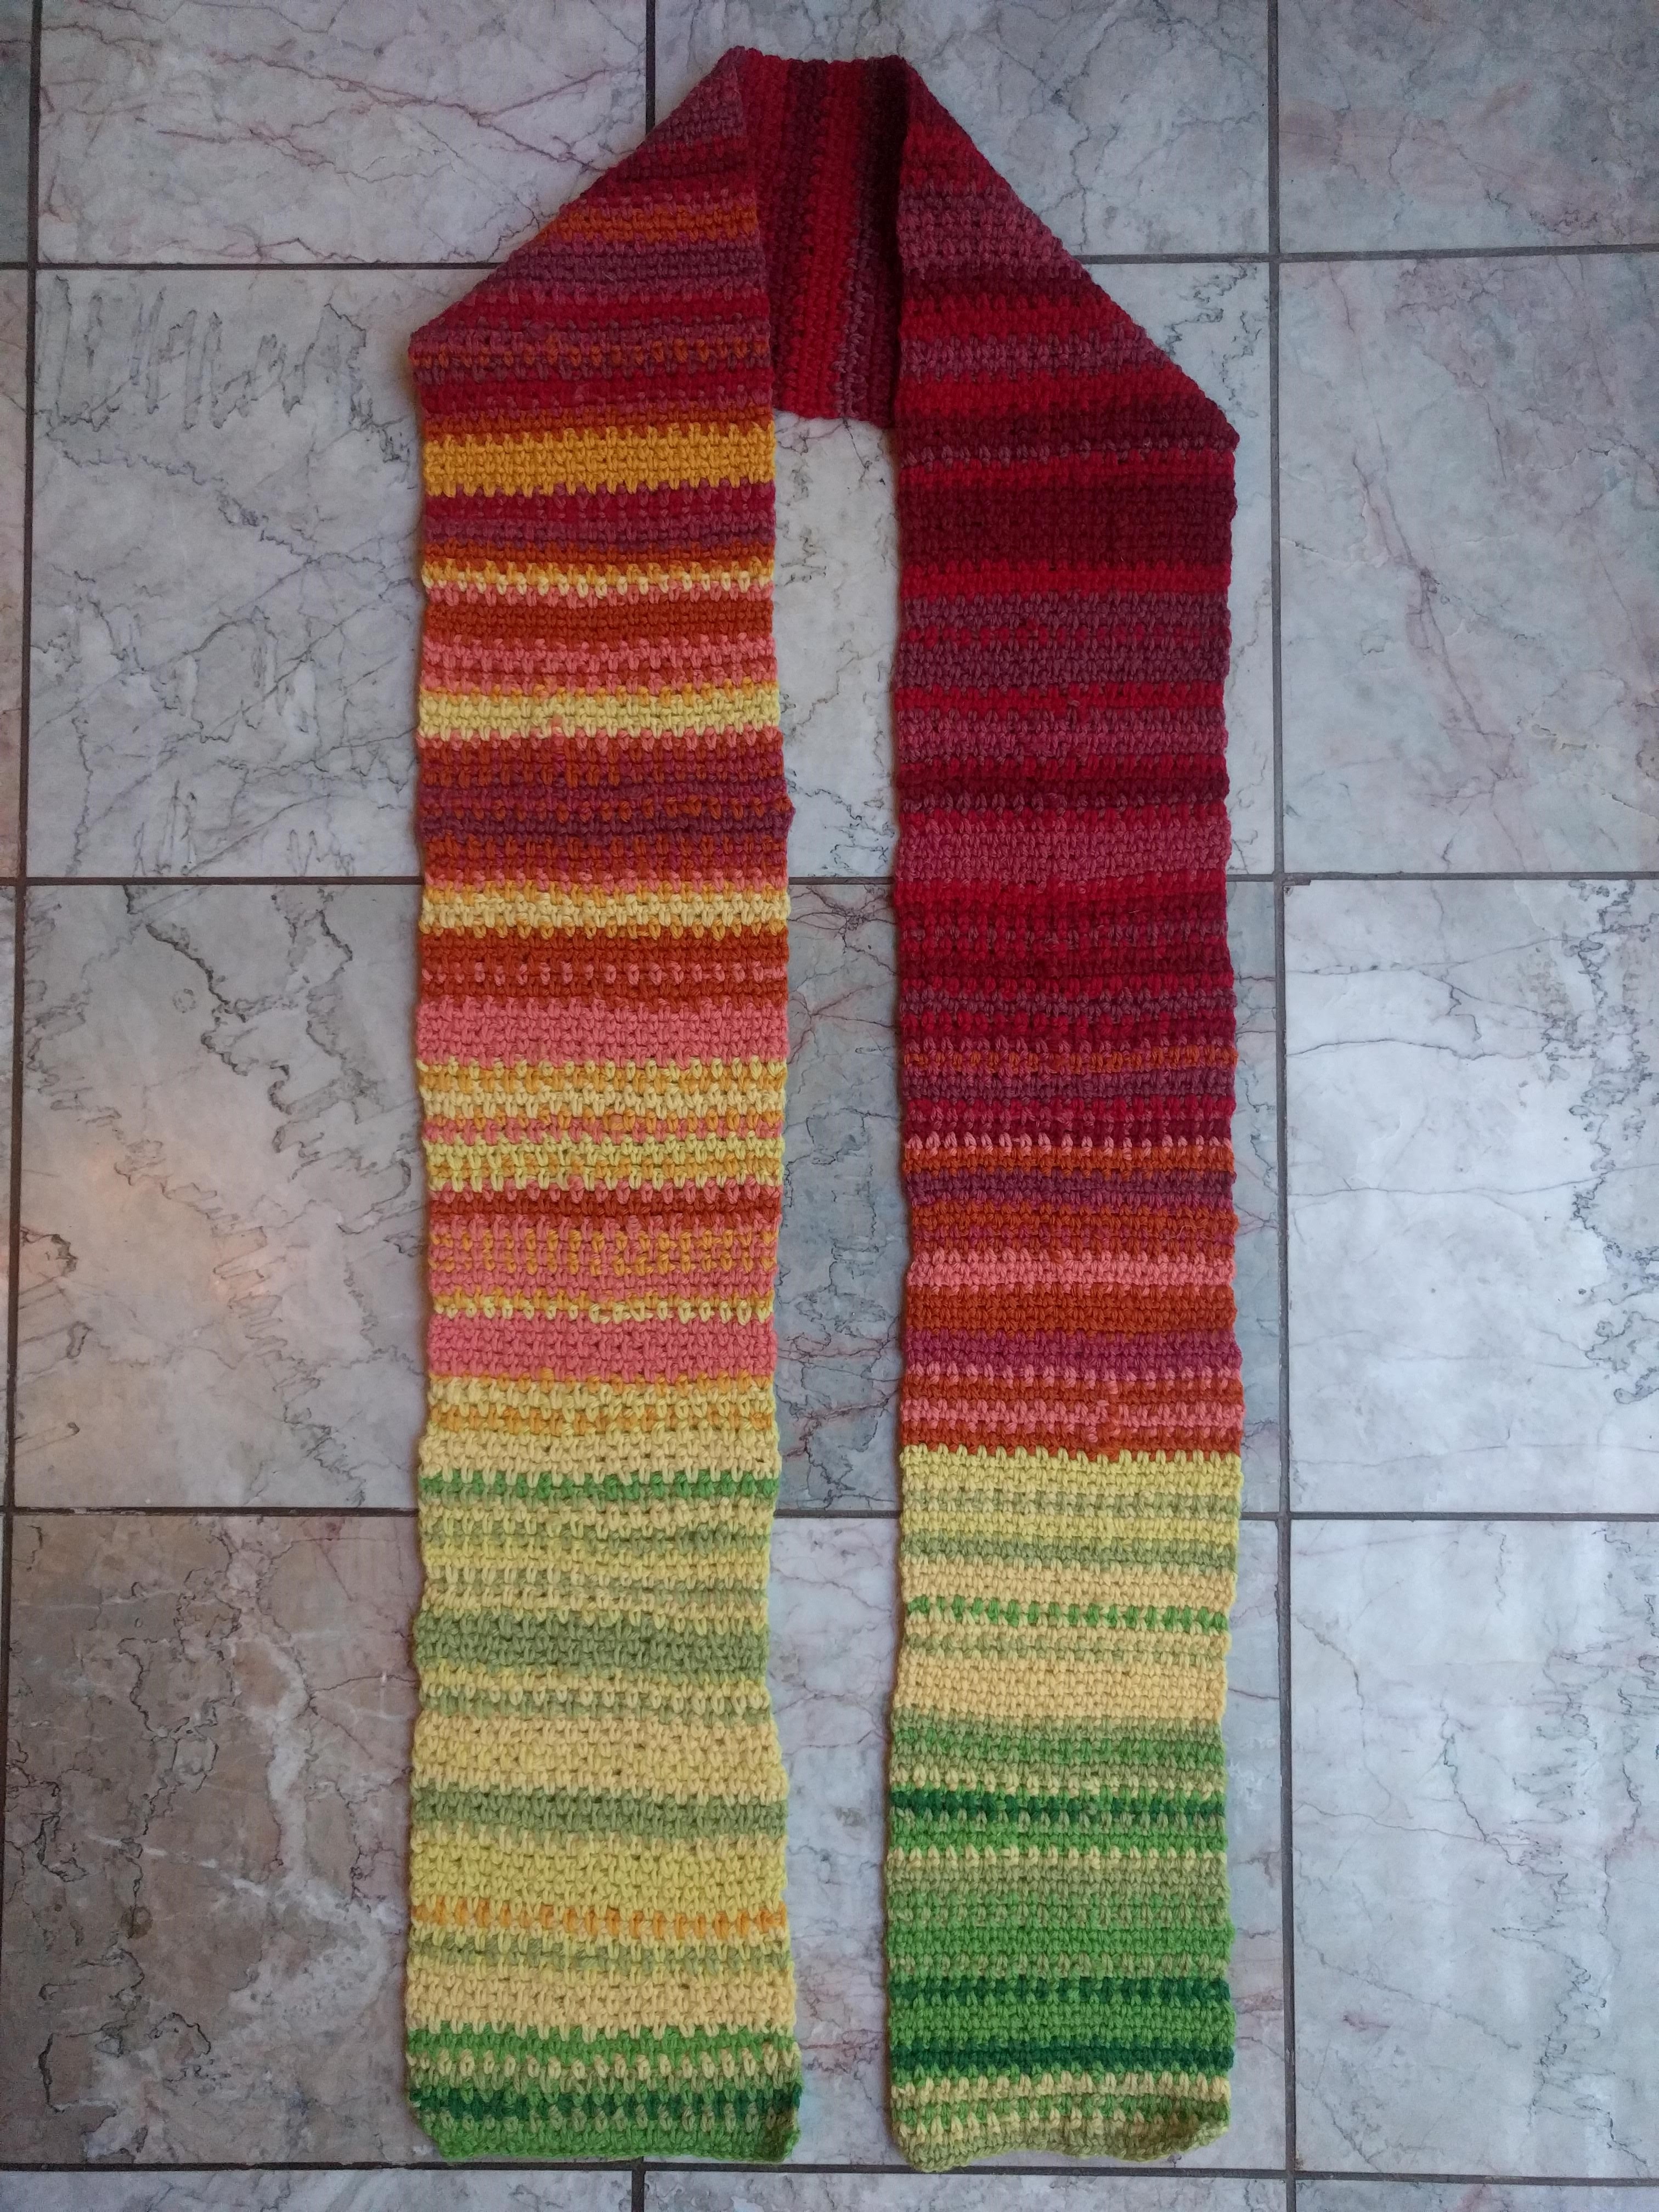
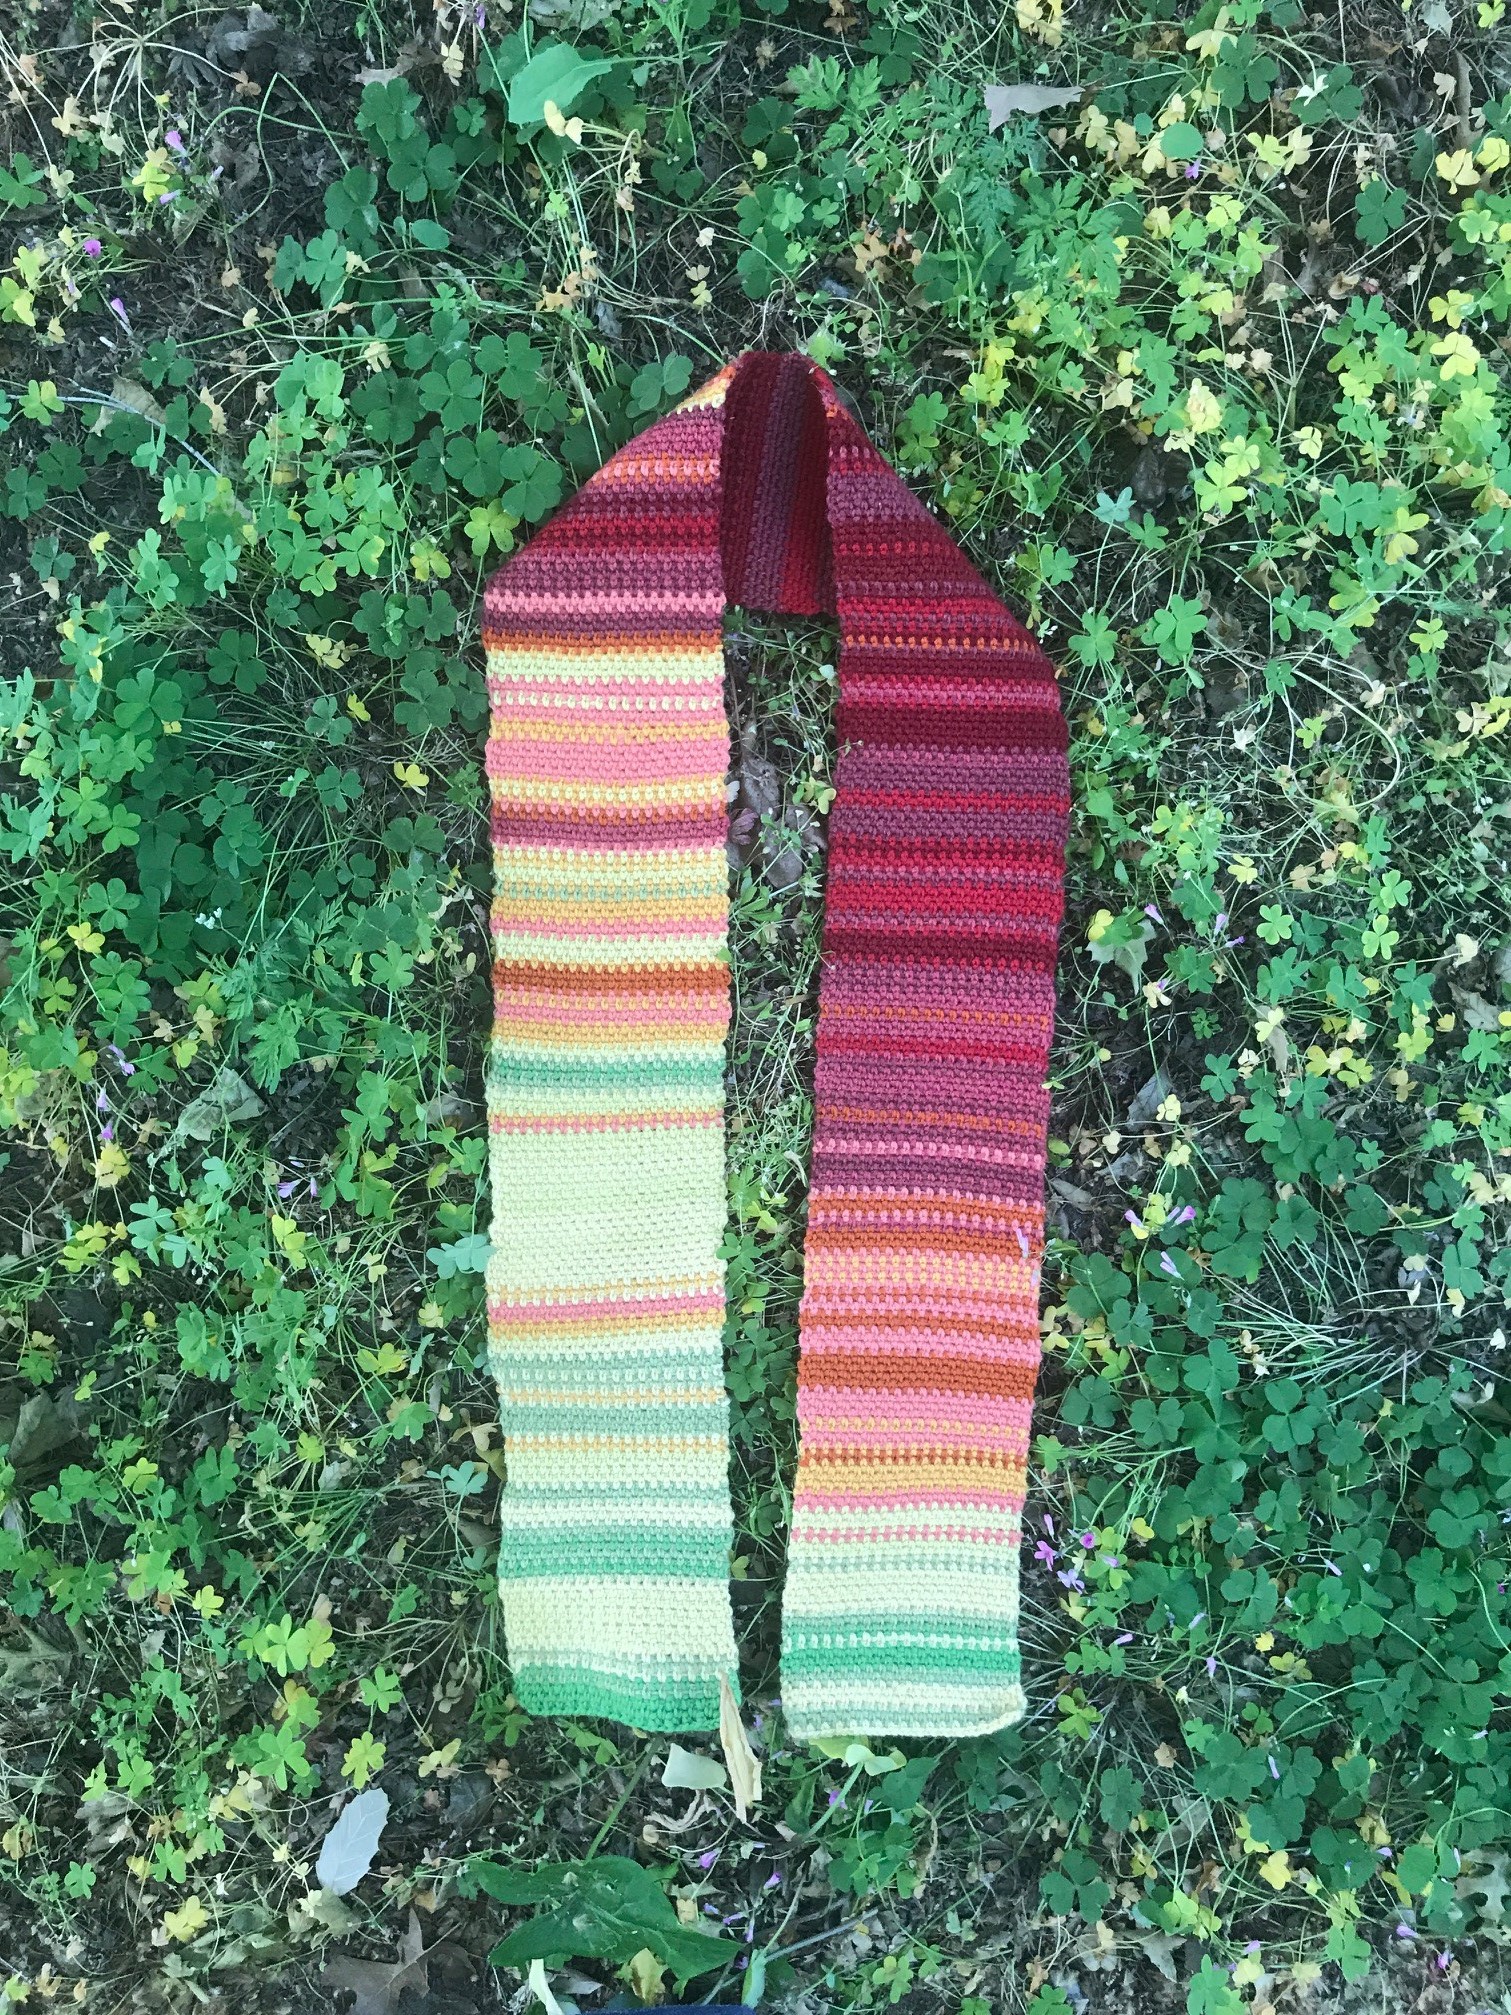
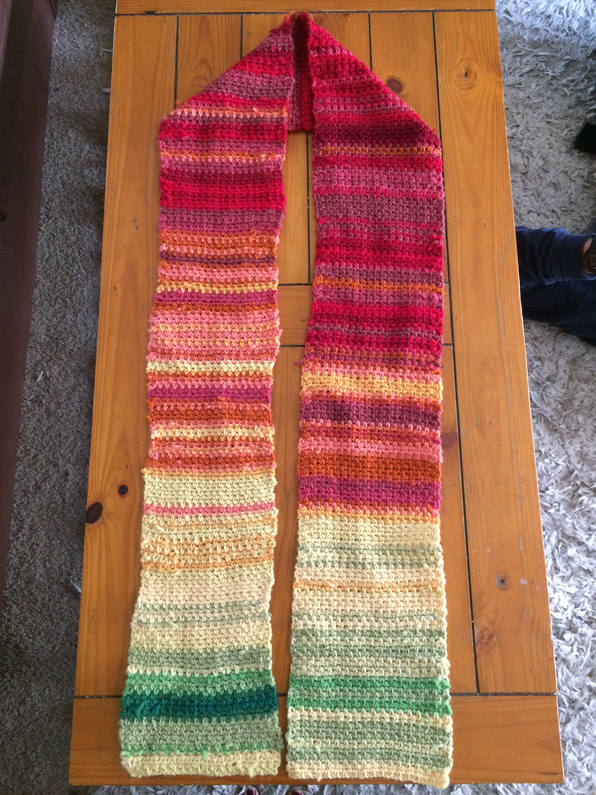
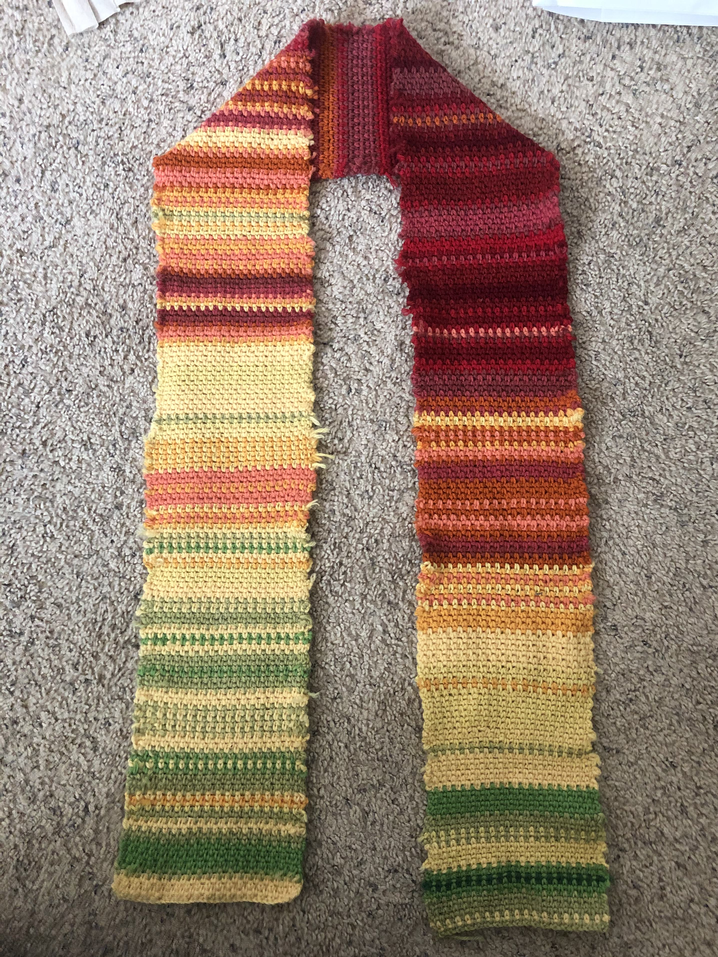
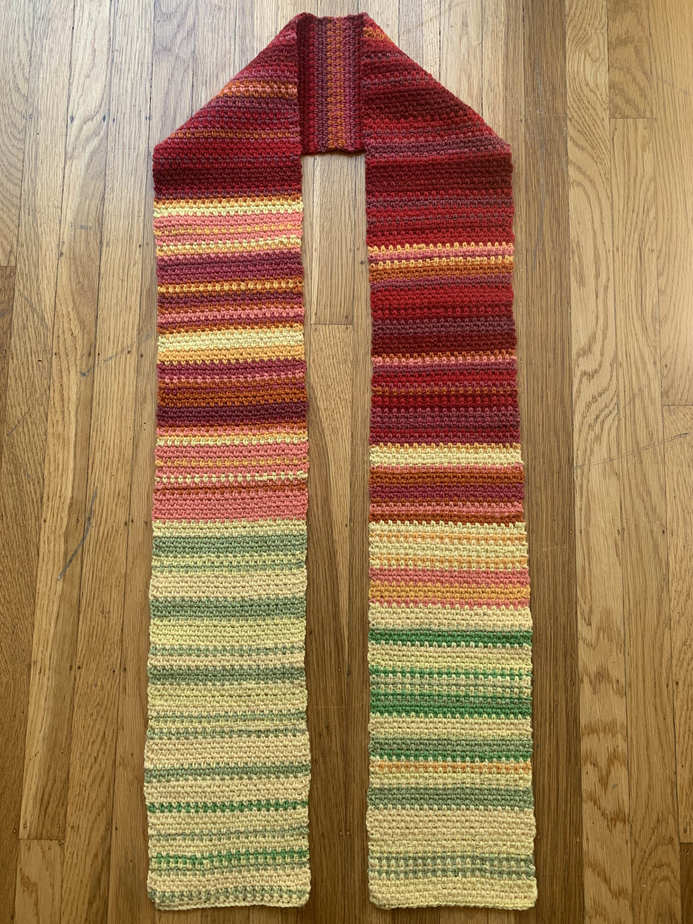
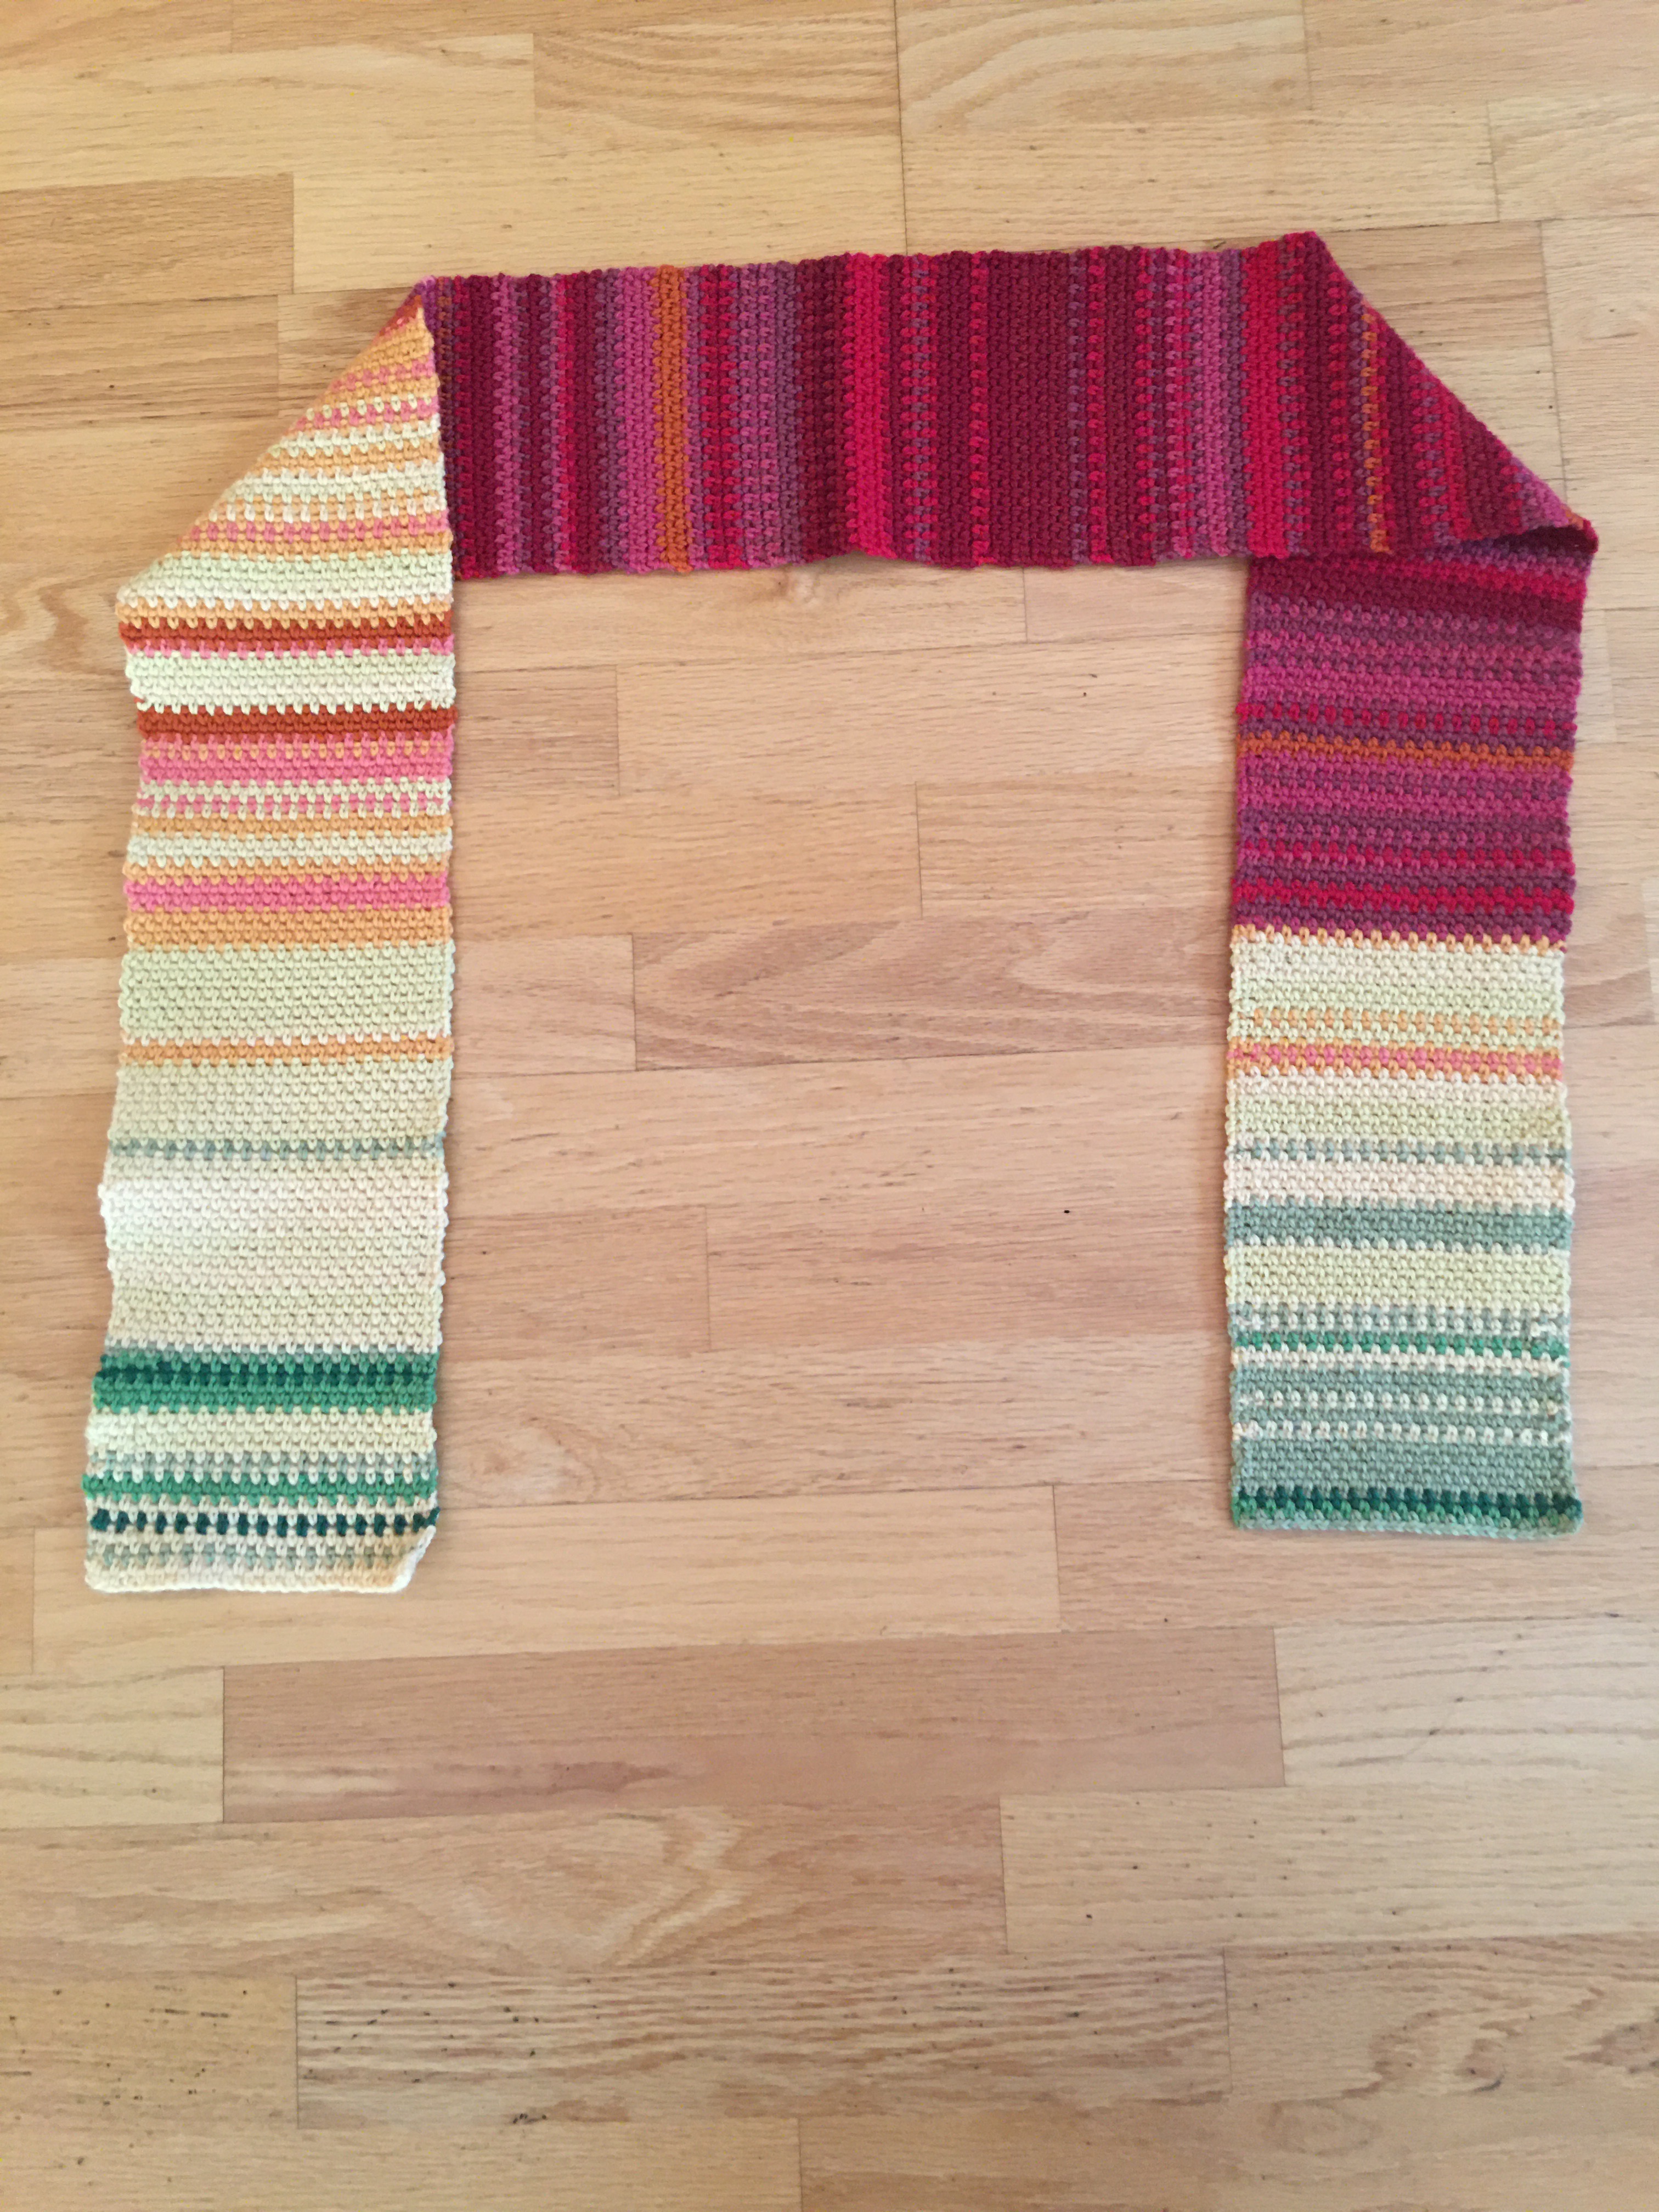
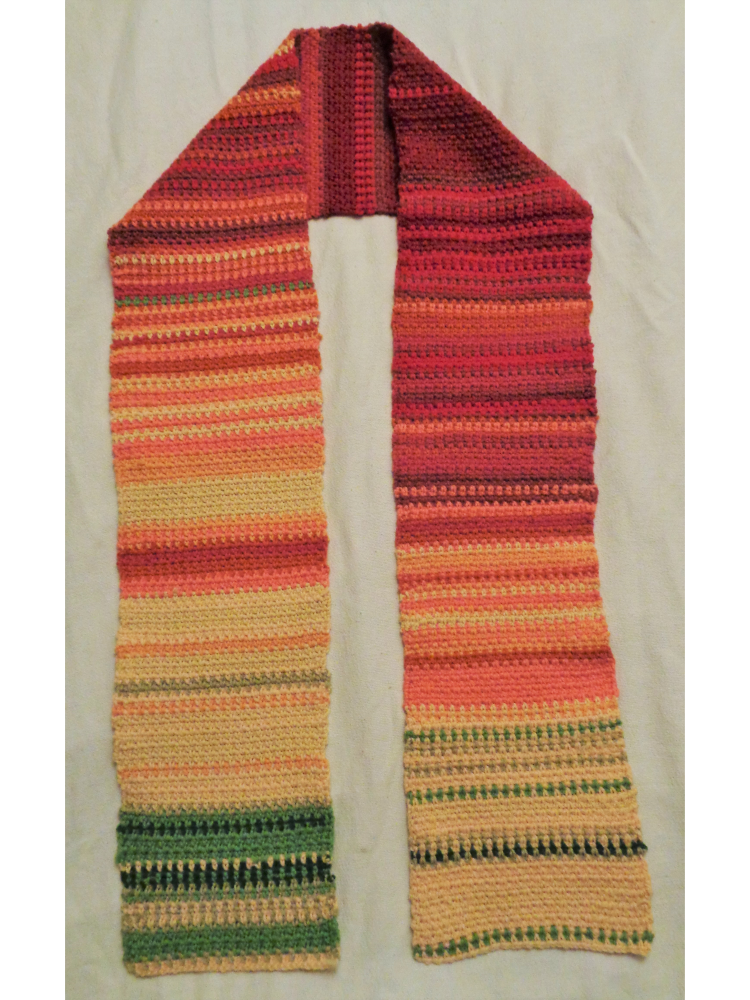
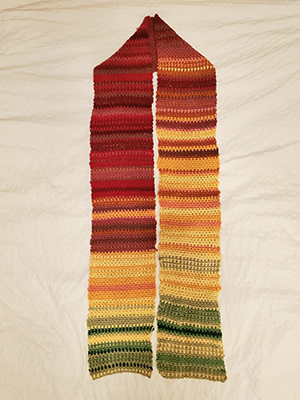
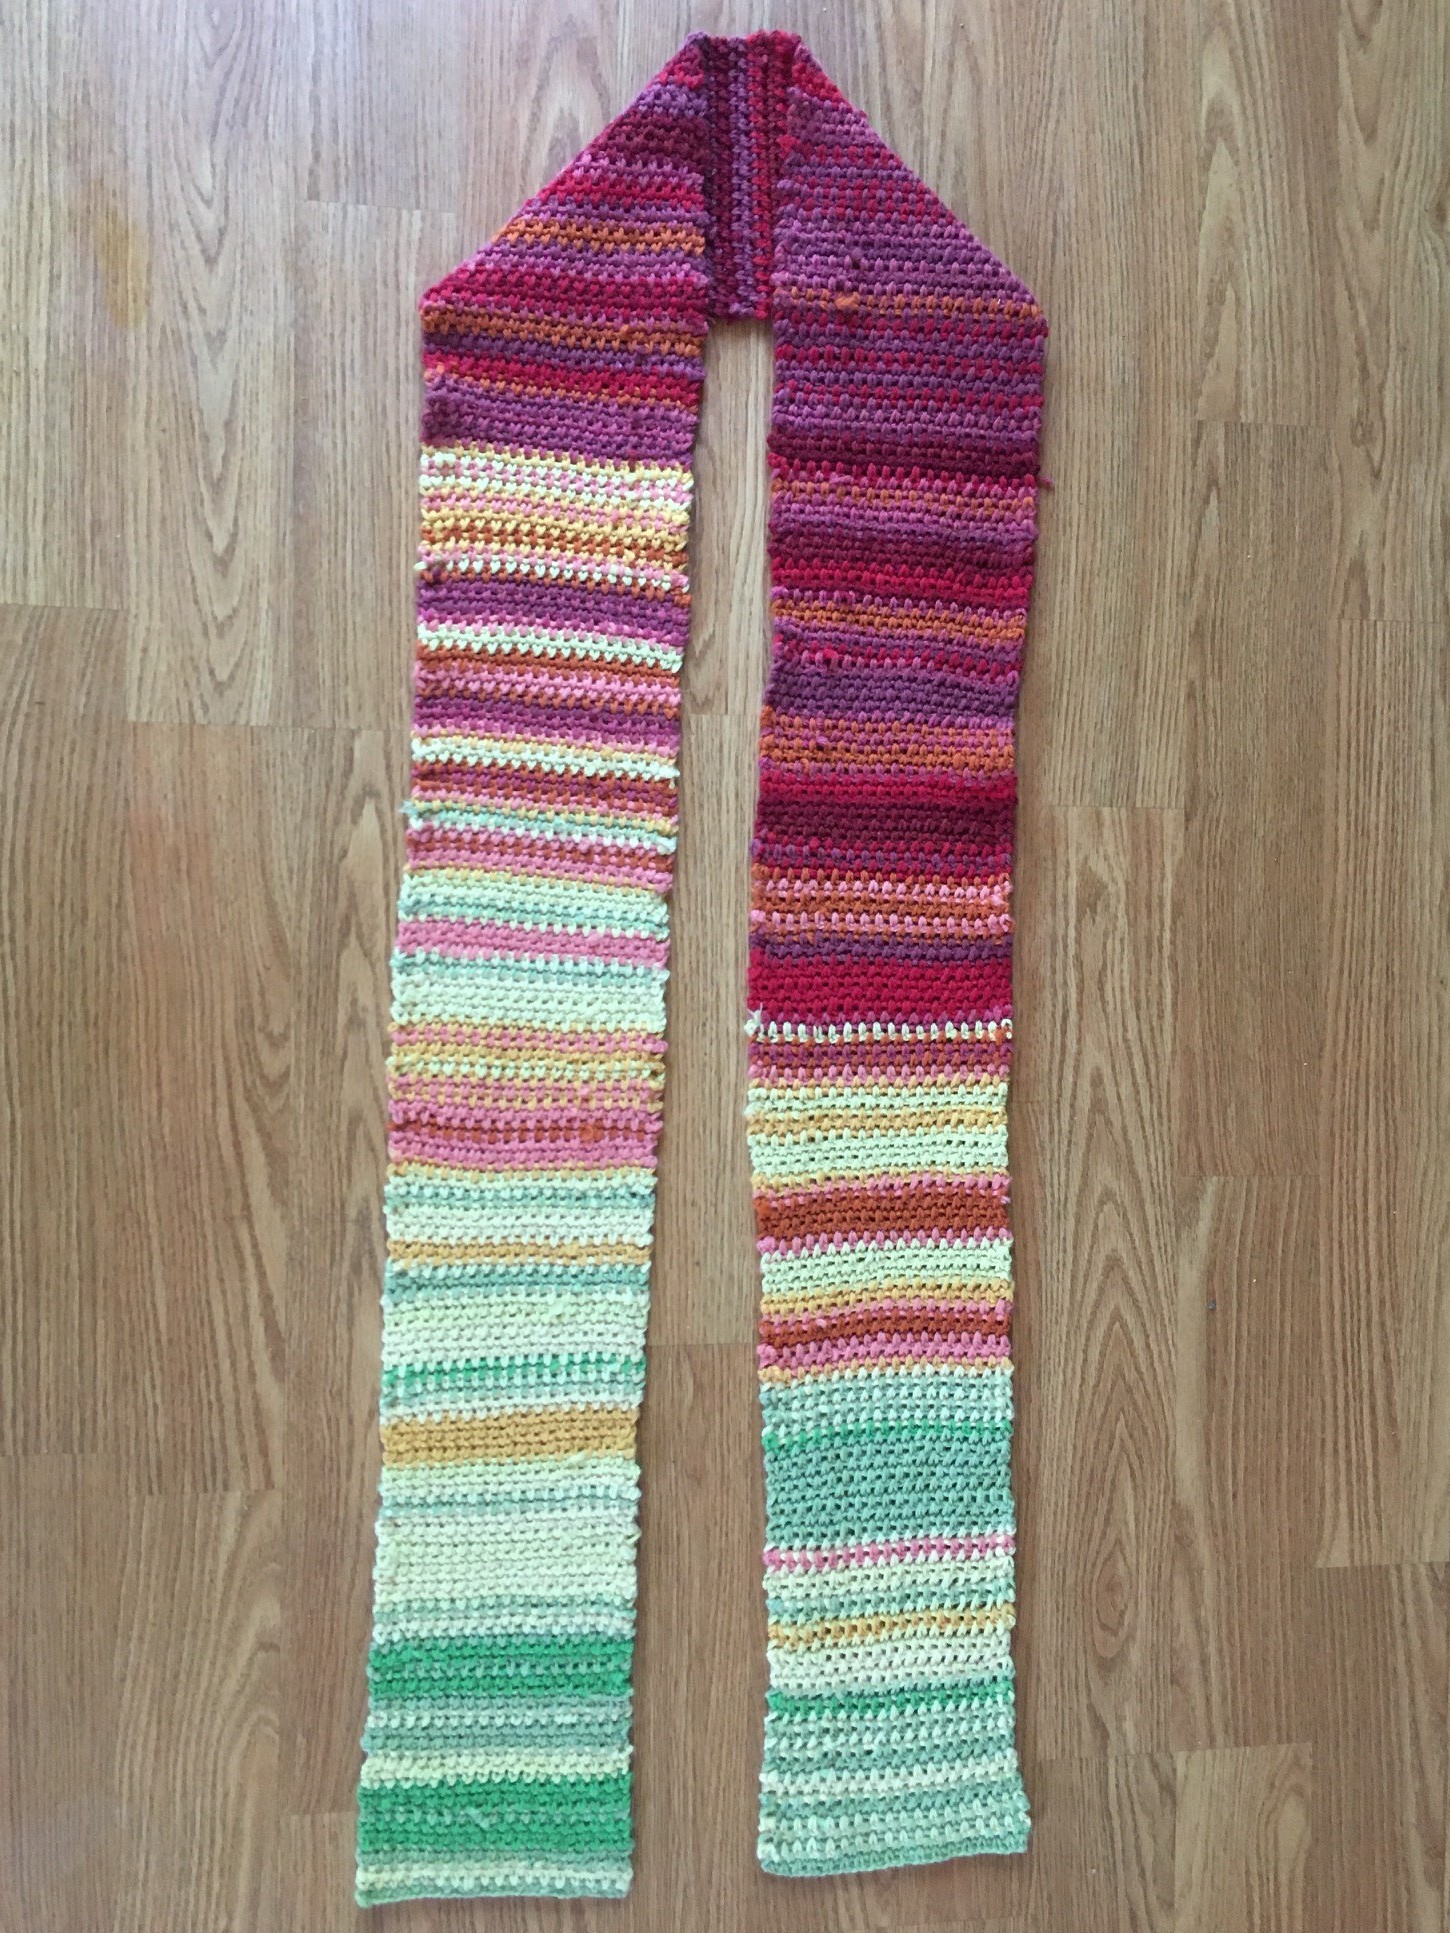
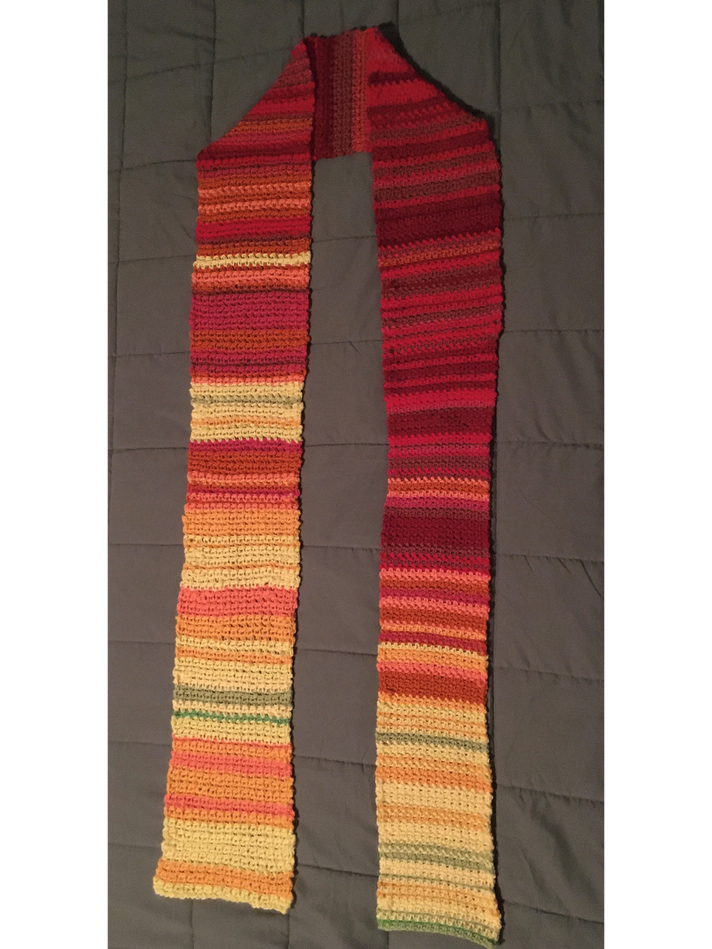
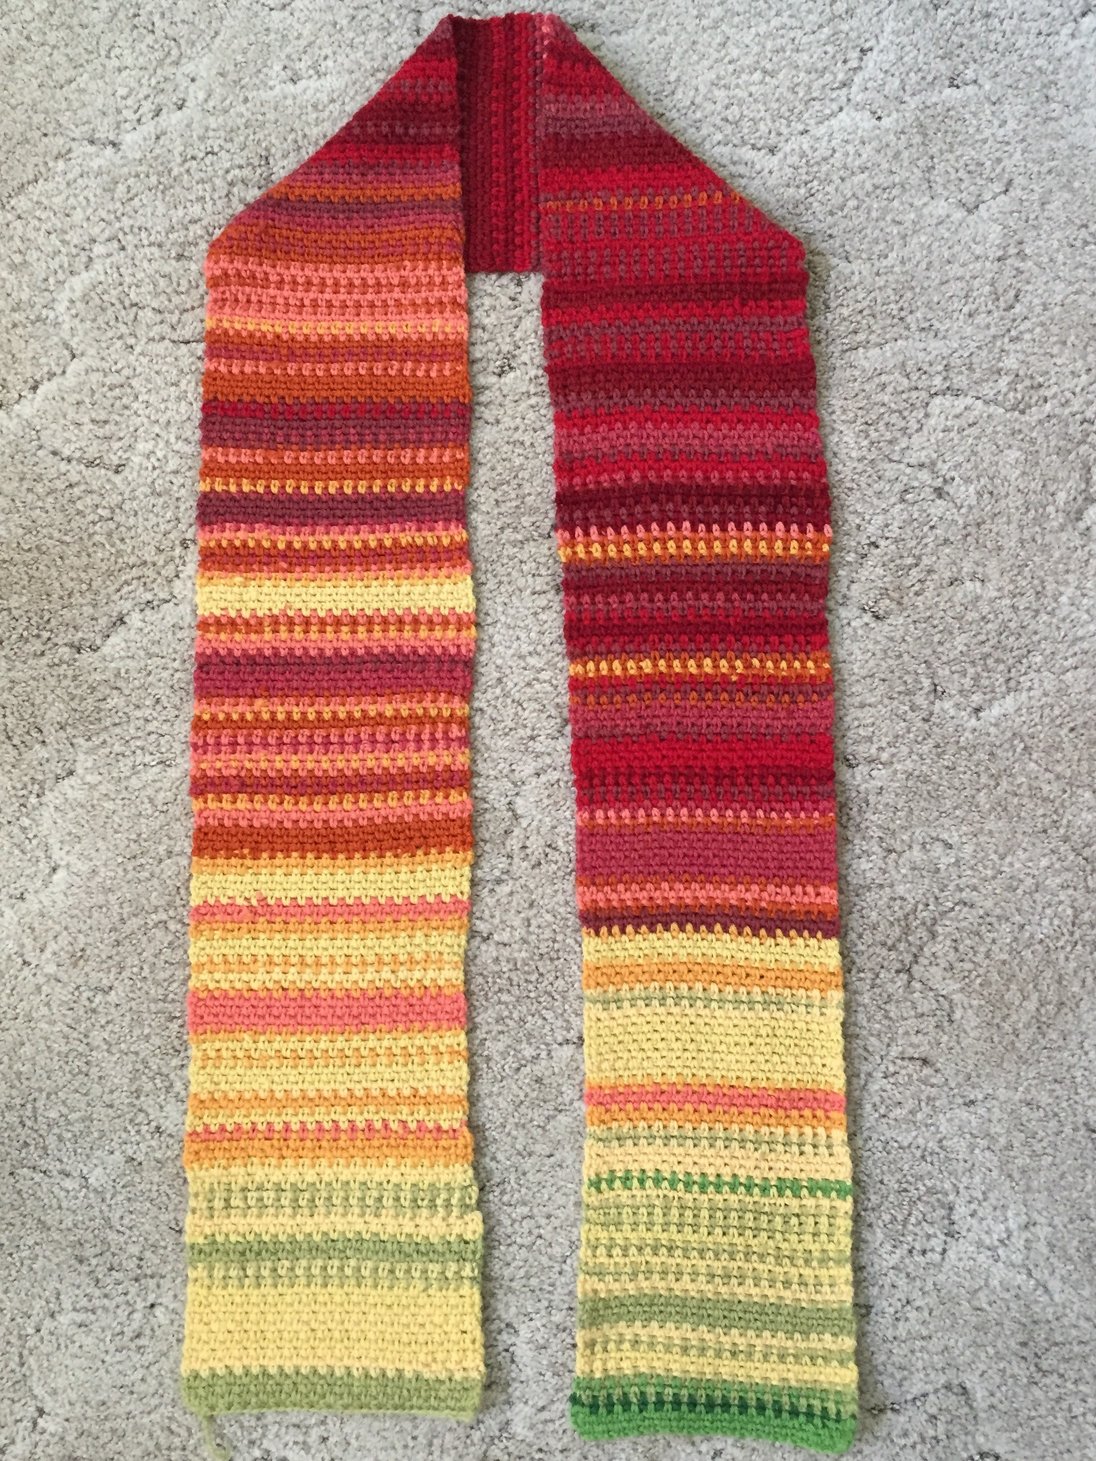
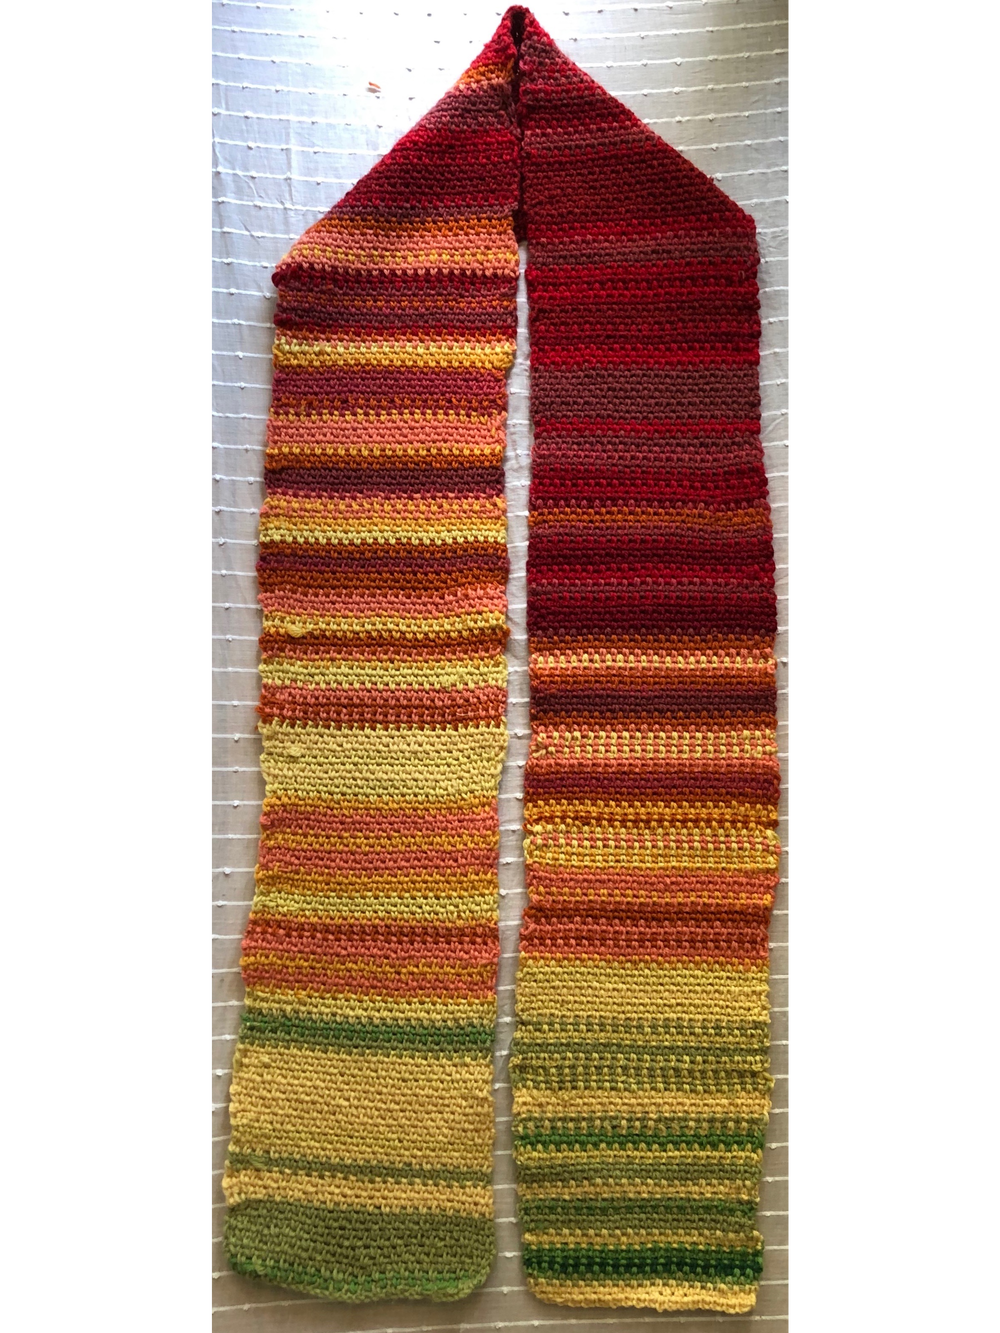
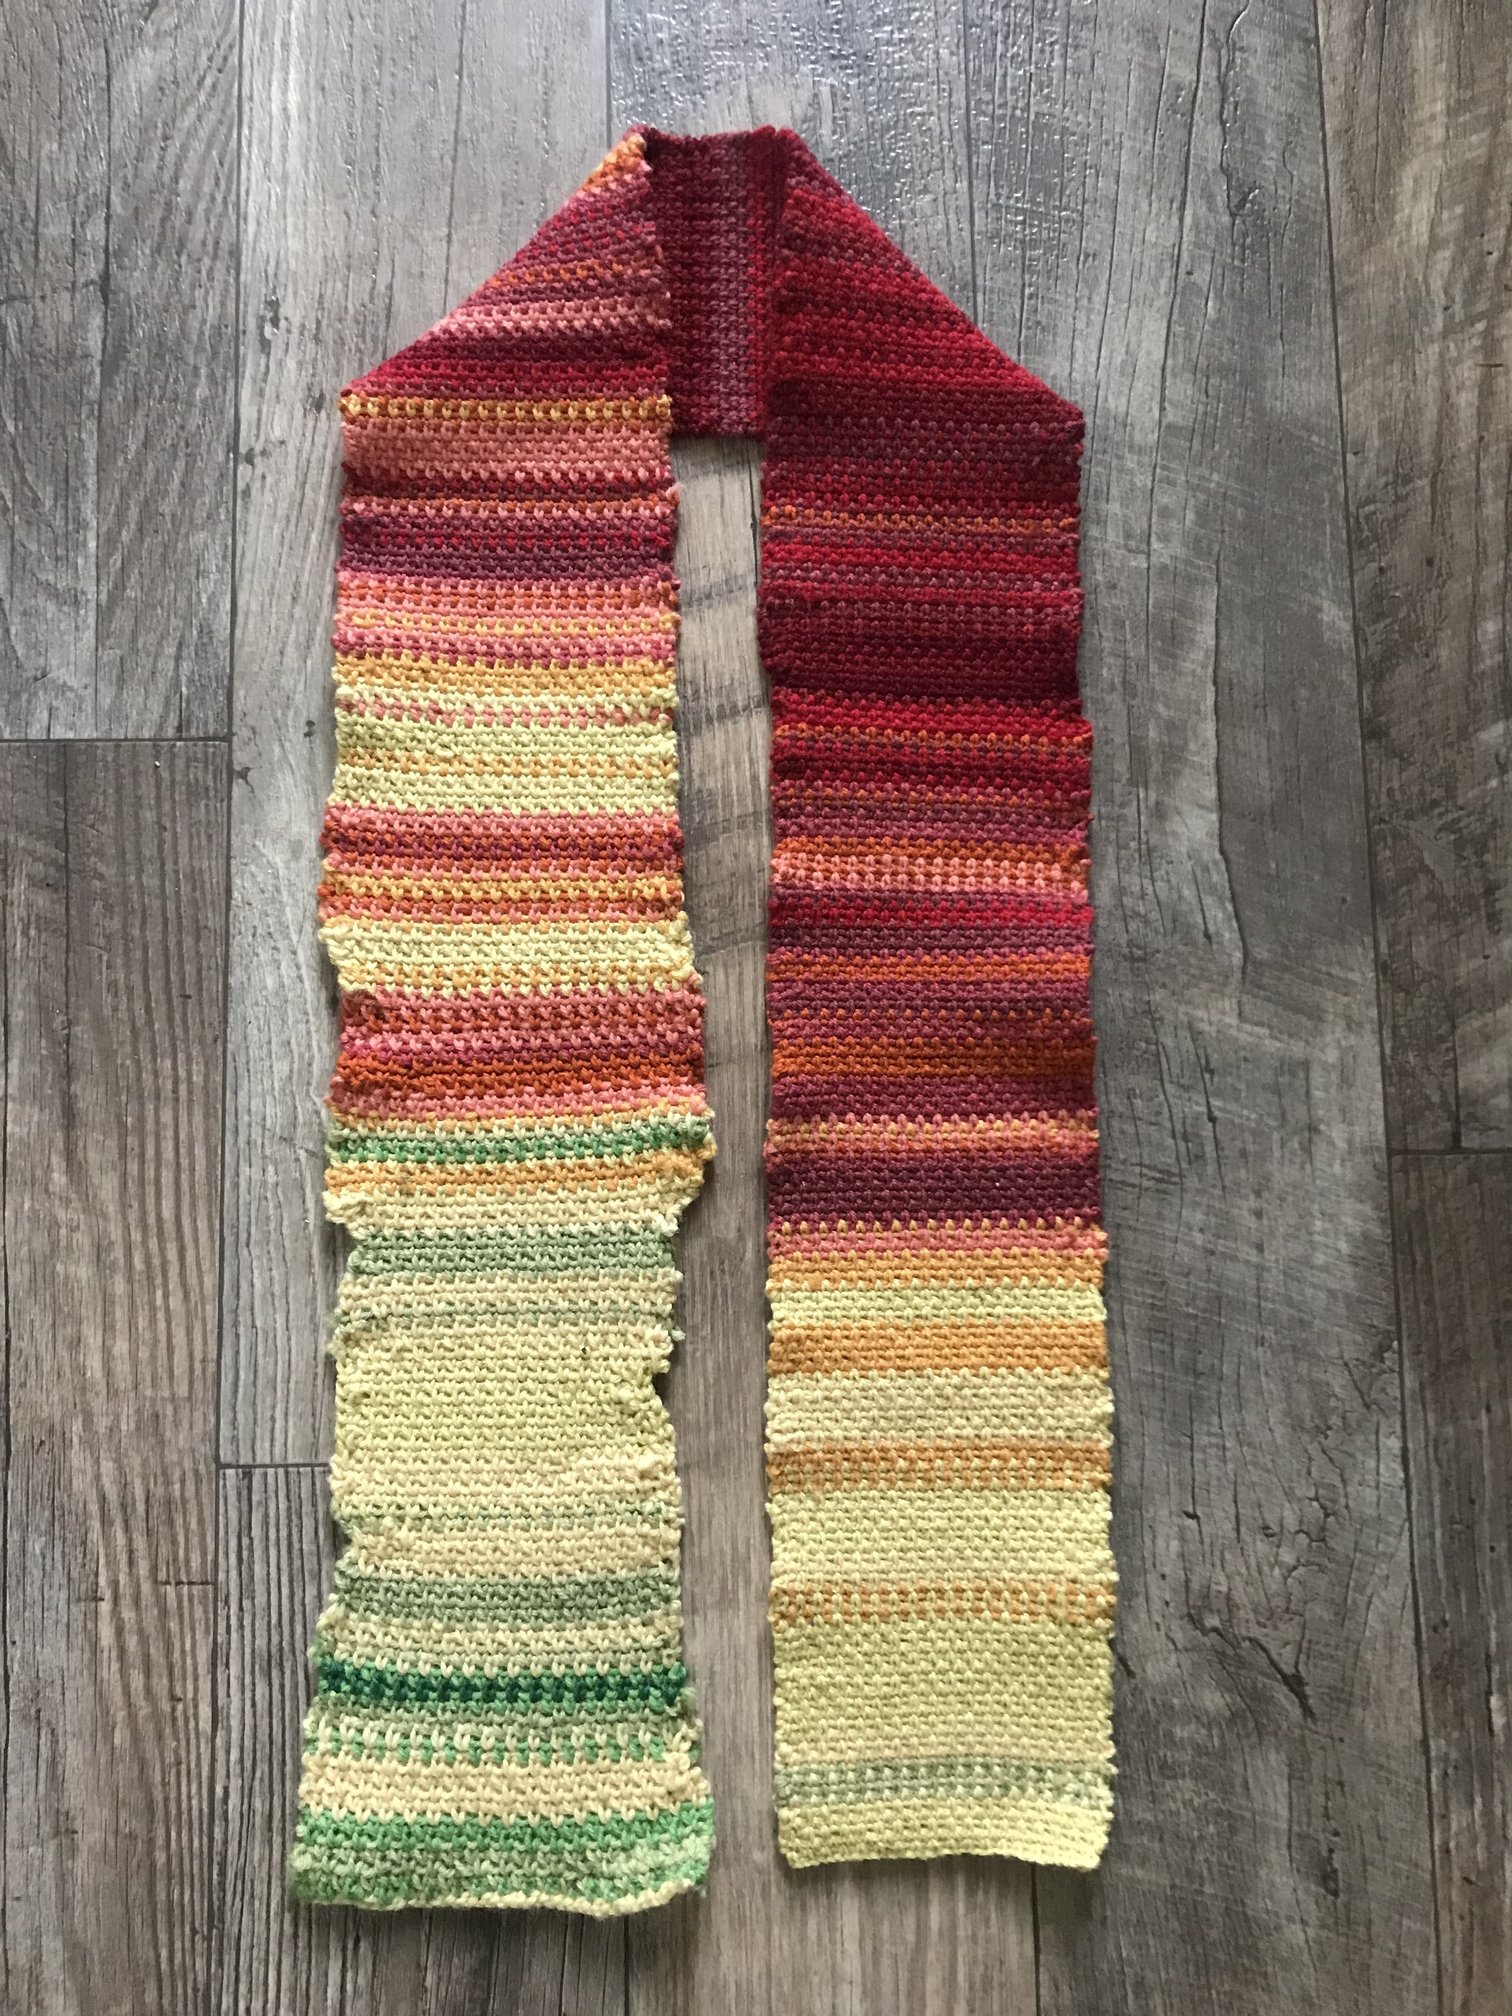
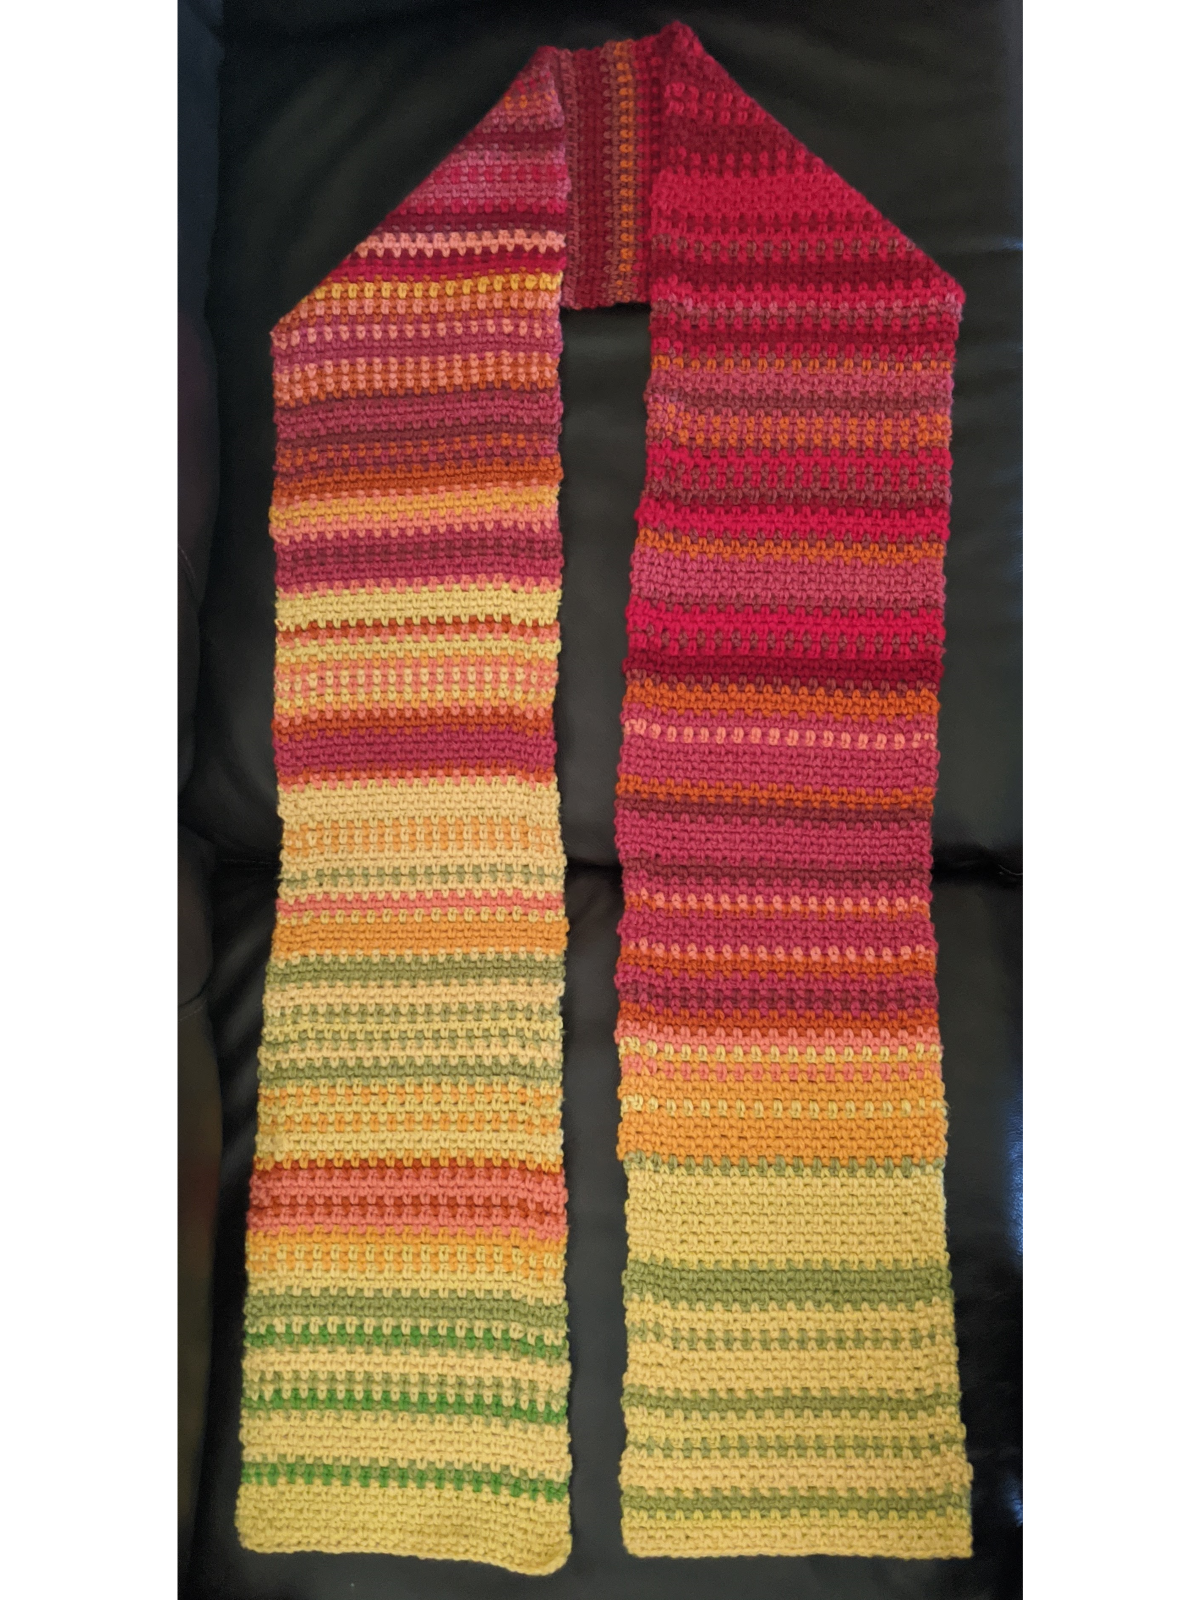
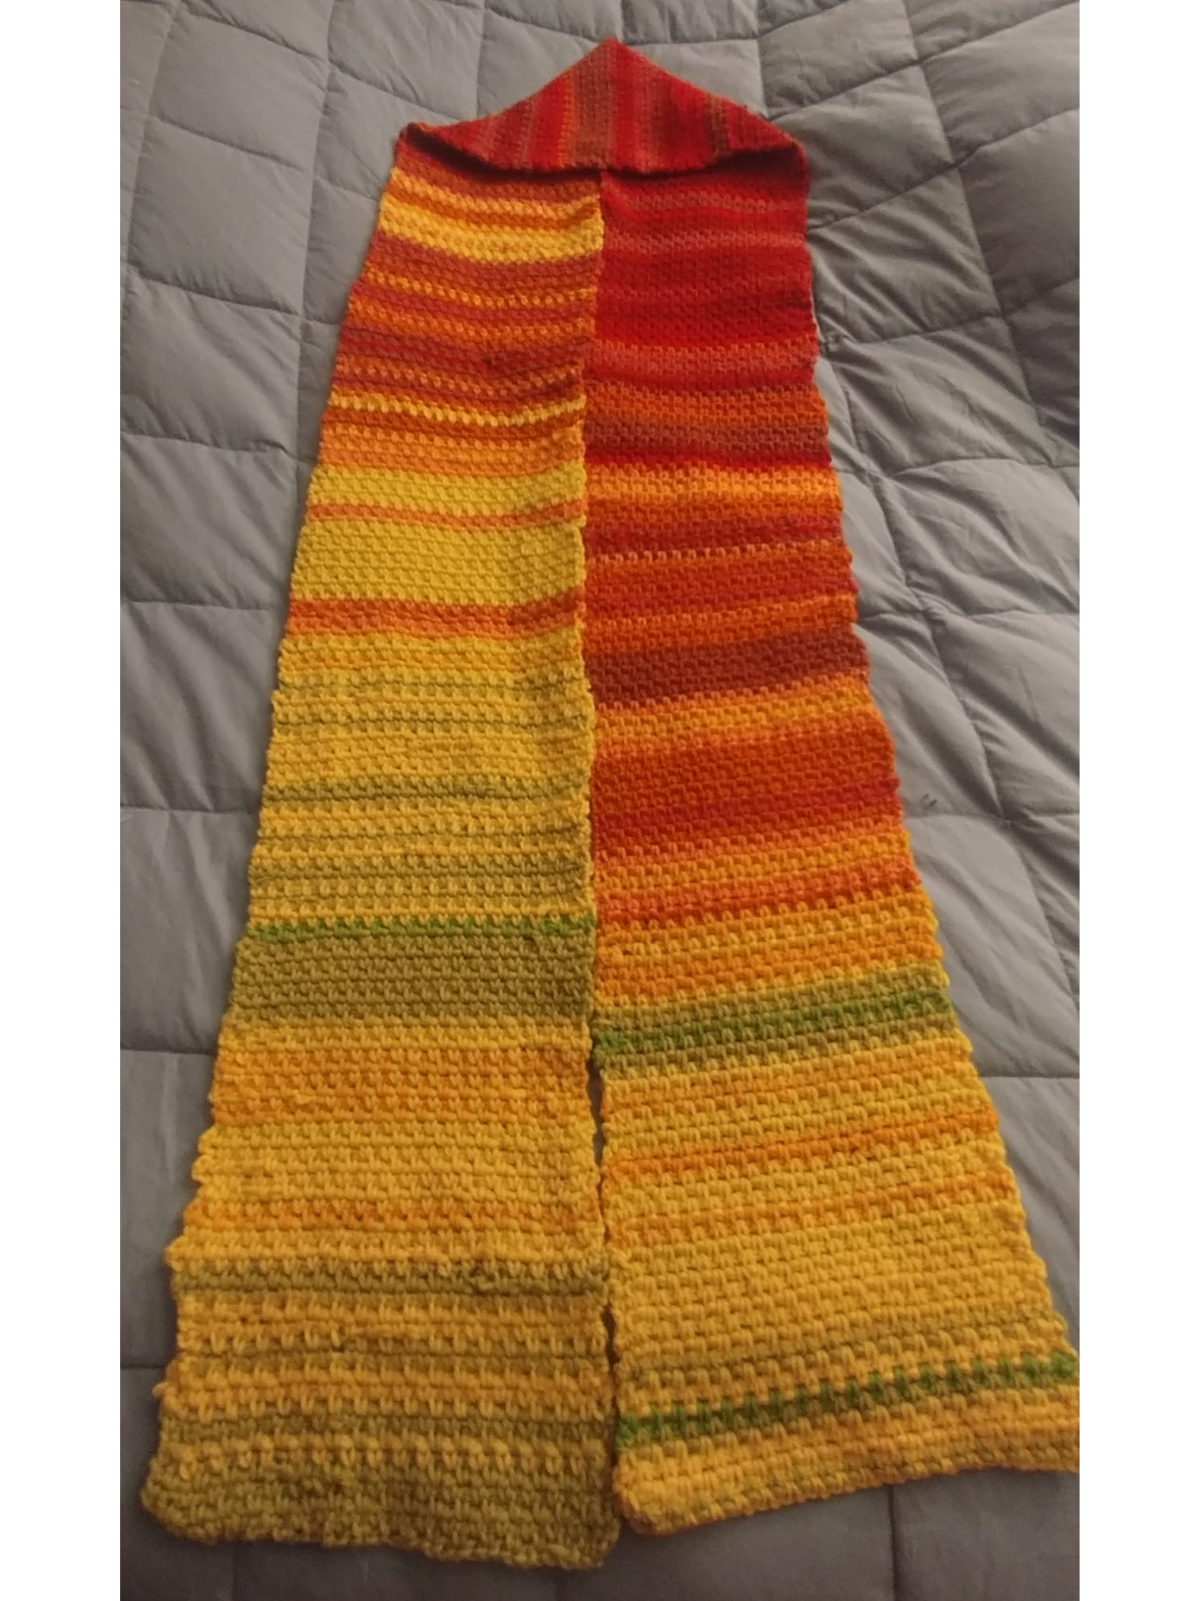
Each temperature tapestry (or “Tempestry”) represents a year of daily high temperatures in Davis, CA, with January on the left side and December on the right of the Tempestry. Cooler colors (blues and greens) represent cooler temperatures while the reds are the highest temperatures. Learn more about the international Tempestry Project.

Please enjoy this virtual exhibit online and check back in for any new Tempestries additions, as well as details for a future in-person exhibit!


Scarf representing the daily temperatures of Davis throughout the year

1971, crocheted by Satoshi Nakamura

Scarf representing the daily temperatures of Davis throughout the year

1974, crocheted by Elizabeth Davis

Scarf representing the daily temperatures of Davis throughout the year

1977, crocheted by Logan Brisette

Scarf representing the daily temperatures of Davis throughout the year

1978, crocheted by Nikki Grey Rutamu


Scarf representing the daily temperatures of Davis throughout the year

1979, crocheted by Rachel Stagi

Scarf representing the daily temperatures of Davis throughout the year

1980, crocheted by Sue Vang

Scarf representing the daily temperatures of Davis throughout the year

1981, crocheted by Corinna Fish

Scarf representing the daily temperatures of Davis throughout the year

1982, crocheted by Ingrid Stromberg


Scarf representing the daily temperatures of Davis throughout the year

1983, crocheted by Patti Mitchell

Scarf representing the daily temperatures of Davis throughout the year

1985, crocheted by Skylar Johnson

Scarf representing the daily temperatures of Davis throughout the year

1990, crocheted by Laura Roser

Scarf representing the daily temperatures of Davis throughout the year

1991, crocheted by Corrie Jacobs


Scarf representing the daily temperatures of Davis throughout the year

1994, crocheted by Afton Geil

Scarf representing the daily temperatures of Davis throughout the year

1995, crocheted by Corinna Fish

Scarf representing the daily temperatures of Davis throughout the year

1997, crocheted by Sequioa Williams

Scarf representing the daily temperatures of Davis throughout the year

1998, crocheted by Aranza Reynoso


Scarf representing the daily temperatures of Davis throughout the year

2000, crocheted by Joel Waite

Scarf representing the daily temperatures of Davis throughout the year

2003, crocheted by Caren Kaplan

Scarf representing the daily temperatures of Davis throughout the year

2005, crocheted by Lori Ann Pardau

Scarf representing the daily temperatures of Davis throughout the year

2008, crocheted by Roxy Rymland and Matthew Demer


Scarf representing the daily temperatures of Davis

2010, crocheted by Kelli O Day

Scarf representing the daily temperatures of Davis throughout the year

2014, crocheted by Emily Fucarino

Scarf representing the daily temperatures of Davis throughout the year

2015, crocheted by Yesenia Reynoso

Scarf representing the daily temperatures of Davis throughout the year

2016, crocheted by Nikki Grey Rutamu


Scarf representing the daily temperatures of Davis throughout the year

2017, crocheted by Jenna Quan

Scarf representing the daily temperatures of Davis throughout the year

 2018, crocheted by Alison Chen 

Scarf representing the daily temperatures of Davis throughout the year

2019, crocheted by Jennifer Rutherford